Your monitoring stack has a blind spot. Here's what technical teams are missing.

.avif)
Ecommerce analytics and monitoring for technical teams means having complete, continuous visibility into front-end issues, performance degradation, session behaviour, and release impact — ranked by their effect on shopper experience and revenue. Done right, it tells engineering teams not just what broke, but what it's costing, and what to fix first.
Most ecommerce engineering teams have some form of monitoring in place. The problem isn't detection — it's that what they're detecting doesn't connect to what actually matters.
The monitoring problem ecommerce technical teams know too well
Here's a scene familiar to every engineering lead who's worked in ecommerce: the error dashboard lights up after a deployment. Hundreds of new events. A spike in JS errors. A handful of network failures. Everything looks urgent.
Three hours later, the team has triaged four issues. Two were pre-existing noise. One affected a handful of internal test users. One — buried in the middle of the queue — was a checkout payment failure that had been silently blocking a percentage of iOS shoppers for six hours.
That's not a detection failure. It's a prioritization failure.
"Before Noibu, it was a firehose of noise. Now, we have the ability to group issues and understand exactly where an issue is coming from. Having that level of technical detail is invaluable to our engineering team."
— Rigel St. Pierre, Sr. Director of Engineering, Mejuri
The issue isn't that general-purpose monitoring tools are bad. It's that they were built for a different problem. APM tools like Datadog were built for backend infrastructure observability. Error trackers like Sentry were built to catch and group JS exceptions across software products broadly. Neither was designed to answer the question that ecommerce engineering teams actually need answered: which of these issues is blocking customers from completing a purchase right now — and how much is it costing?
Why general-purpose monitoring falls short in ecommerce
It measures technical severity, not revenue impact
A JS error that fires on every page load but doesn't affect any user interaction looks alarming in a general-purpose monitoring stack. A checkout payment failure that silently prevents 2% of users from placing orders may generate far fewer raw events. In a standard error queue, the noisy irrelevant issue wins attention. In a purpose-built ecommerce platform, the checkout failure is immediately surfaced as high-priority with a revenue impact estimate attached.
The difference isn't the data. It's the context layer on top of it.
It doesn't speak the ecommerce funnel
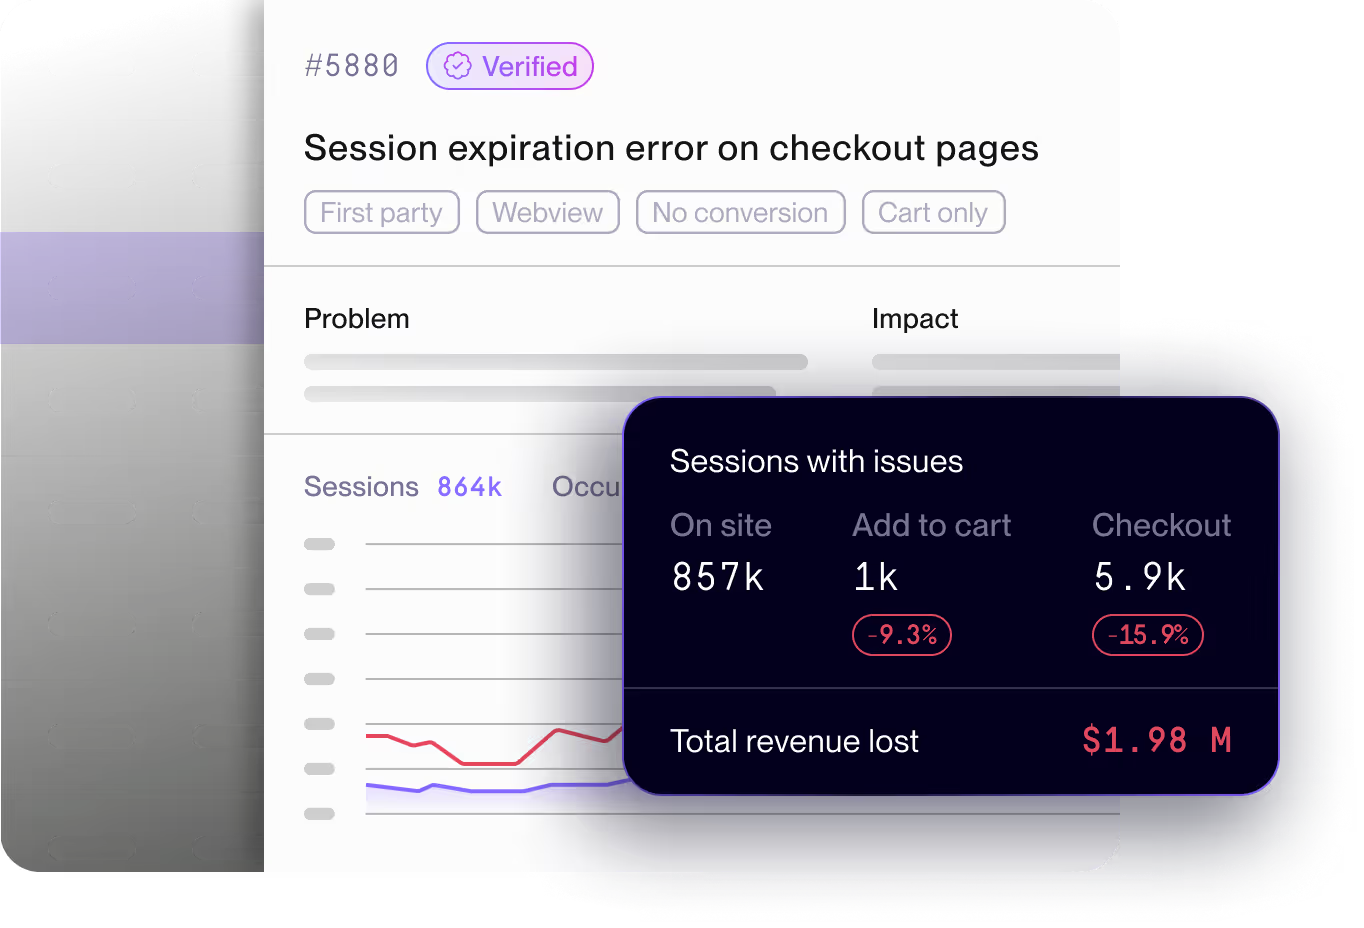
General-purpose APM and RUM tools don't know what "checkout" means. They don't understand the difference between an issue that fires on a homepage banner and one that fires at the payment confirmation step. They can't tell you that Issue #4884 is a "Checkout" funnel issue affecting 17,100 sessions with an estimated $15,100 in revenue at risk.
Ecommerce technical monitoring requires funnel-stage awareness baked into the issue model — not bolted on through custom dashboards after the fact.
It creates cross-team translation gaps
When an engineering lead needs to escalate a fix to the product roadmap, they need to speak in business language. "There's a JS error affecting 2% of checkout sessions" doesn't move a sprint. "This issue is blocking checkout for 17,000 sessions, costs an estimated $147k annually, and is tagged High priority" does.
General-purpose tools hand engineers raw technical data. Ecommerce teams need that data translated into business impact automatically — so product, engineering, and CX are working from the same picture without requiring manual analysis to bridge the gap.
"Since integrating Noibu, the time we spend resolving issues has dropped drastically. What used to take 10 hours a week can now be addressed in just two, allowing our developers to be much more efficient."
— Tim Haverman, C# .NET Software Developer, Store Supply Warehouse
What ecommerce analytics and monitoring needs to do for technical teams
Purpose-built ecommerce analytics and monitoring closes four gaps that general-purpose tools consistently leave open.
1. Detect 100% of front-end issues — without sampling
Sampling is a cost-efficiency mechanism in general-purpose tools. In ecommerce, it's a liability. A checkout issue affecting 1.5% of sessions on a specific device and browser combination will be missed entirely if your platform is sampling at 10%. And because ecommerce failures cluster disproportionately in high-stakes funnel stages — payment, cart, checkout confirmation — sampling is most dangerous exactly where you can least afford blind spots.
Purpose-built ecommerce monitoring captures 100% of front-end issues, grouped by signature, across every session.
2. Prioritize by ecommerce funnel impact, not issue volume
Issue volume is noise. What matters is which problems are blocking purchases. Effective ecommerce analytics and monitoring automatically ranks issues by: number of affected sessions, funnel stage (on-site vs. checkout vs. payment), estimated revenue at risk, and whether the issue is new, spiking, or a pre-existing baseline.
This is the difference between a triage queue that takes three hours to work through and a prioritized issue list that tells an engineer exactly where to start.
3. Give engineers everything needed to reproduce and resolve
Detection without reproducibility just creates a different kind of frustration. Ecommerce technical monitoring needs to surface not just the issue signature, but the complete context required to diagnose root cause and fix it fast: full session replays, stack traces with source maps, HTTP request and response payloads, browser and OS impact breakdowns, and reproduction steps.
The goal is to eliminate the back-and-forth between front-end engineers, support agents relaying customer complaints, and product managers asking for impact assessments. One issue record should contain everything every stakeholder needs.
4. Connect deployments to behaviour changes automatically
Post-release regressions are one of the highest-cost failure patterns in ecommerce engineering. A change that looked clean in staging introduces a checkout failure on a specific browser in production. Without release-correlated monitoring, the time between deployment and detection can stretch to hours or days. With it, the regression surfaces within minutes — tied directly to the deployment that introduced it.
%20(1).gif)
How Noibu approaches ecommerce analytics and monitoring for technical teams
Noibu is the leading ecommerce analytics and monitoring platform, built to give technical teams the signal-to-resolution clarity that general-purpose tools can't provide.
Issues & Alerts: From raw signal to prioritized action
Noibu's Issues & Alerts turns the raw issue stream into a ranked, actionable list. AI-powered grouping clusters problems by signature, eliminates duplicate noise, and automatically evaluates each issue against ecommerce funnel impact — surfacing what matters and deprioritizing what doesn't.
Each issue record includes: estimated annual revenue at risk, session count, funnel stage classification, browser and OS impact breakdown, AI-generated explanation, and a direct link to relevant session replays. Engineers know exactly what to fix, why it matters, and how to reproduce it — without manual triage. Custom alerting ensures high-impact issues trigger immediate notifications rather than waiting to be discovered in a routine review. And Jira integration means a confirmed issue moves directly into the engineering workflow without manual ticket creation.
Session Replay: Full context for faster root cause
Reproducing a front-end issue without session context is guesswork. With Noibu's Session Replay, engineers can watch exactly what happened — the full user journey, the interactions that preceded the issue, the technical events in the session timeline — with LCP, INP, and HTTP event overlays showing performance signals alongside behavioural ones.
Noibu captures 100% of sessions with no quotas. For ecommerce technical teams, this matters most when investigating issues on minority device segments: a payment failure that only affects iOS 17 users on Safari won't be in your session library if your tool sampled it away.
Performance Monitoring: Page speed tied to conversion
Noibu measures Core Web Vitals with real user data — not synthetic lab scores — and benchmarks against best-in-class ecommerce brands. For engineering teams, this means seeing exactly where load delay, render delay, and interaction-to-next-paint scores are falling short, with revenue impact estimates attached to each gap.
The benchmarking context is what separates actionable performance monitoring from a dashboard full of numbers. Knowing your PDP LCP is 4.26s tells you there's a problem. Knowing the best-in-class benchmark on Noibu is 1.2s — and that the gap represents a projected $578k annual revenue loss — tells you it's worth a sprint.
"We used Noibu to shave seconds off our load time, which is a massive signal to search engines that we are relevant and fast. It allowed our developers to stop fighting backend fires and start spending more time on the frontend improvements that actually drive our PageRank and conversion."
— Philip Krynsky, CEO & Founder, Rvinyl
Release Monitoring: Catch regressions before customers do
Noibu's Release Monitoring automatically correlates every deployment with changes in issue rates, performance scores, and behaviour patterns. The moment a release introduces a regression — a checkout issue that wasn't present before, a PDP performance degradation, a new JS failure pattern — it surfaces in the post-release report tied directly to that deployment.
This closes the loop between engineering velocity and site stability. Teams can deploy with confidence, knowing regressions will surface immediately rather than festering until a customer complaint triggers a fire drill.
Ecommerce analytics and monitoring vs. general-purpose tools
The cost of reactive technical monitoring in ecommerce
Every ecommerce site has a running tab of technical debt it doesn't know about. Issues that were never detected. Performance degradations masked by aggregate scores. Regressions that slipped through because post-release monitoring was manual. Each of these has a dollar figure — it just hasn't been calculated yet.
The teams that close this gap aren't running more sprints. They're spending those sprints on the right things.
"Before Noibu, we had no visibility into any of our front-end issues. Now we have a single pane of glass that our teams can go to and understand what the issue is, how many people it's impacting, when it started, and what's the impact ultimately to our conversion funnel."
— Nathan Armstrong, Director of Customer Solutions, Pampered Chef
The shift from reactive to proactive monitoring in ecommerce isn't about adding more tools. It's about replacing volume with signal — giving engineering teams the clarity to act confidently and fast.
Want to see what's currently running on your site undetected? Noibu's free website audit surfaces the front-end issues, performance gaps, and regressions most likely to be costing your team — and your business.
Or see how Noibu fits into your existing technical stack: https://www.noibu.com/demo
Related topics:
- Why ecommerce leaders are consolidating monitoring and analytics into a single platform
- Mobile ecommerce monitoring: what you're missing and what it costs
- The practical guide to Page Analysis and Digital Experience Analytics
- How to reduce MTTR for ecommerce front-end issues
- What is Release Monitoring — and why ecommerce engineering teams need it
Stop triaging noise. Start fixing what costs you.
Noibu's free website audit reveals the front-end issues, performance gaps, and post-release regressions currently running on your site — ranked by revenue impact, ready for your team to act on.
Run your free website audit →
Prefer to see it in the context of your own stack? https://www.noibu.com/demo
About Noibu
Noibu is an ecommerce analytics and monitoring platform that gives teams complete visibility into errors, performance, sessions, and digital experience — so issues and opportunities are found, prioritized, and acted on before customers feel the impact.

.avif)