The practical guide to Page Analysis and Digital Experience Analytics (DXA) for ecommerce

Ecommerce teams don’t have a traffic problem — they have a conversion throughput problem.
Brands invest heavily to bring shoppers to their site, yet the vast majority of sessions never turn into revenue. While some visitors are always just browsing, a meaningful share of abandoned sessions come from shoppers who intended to buy but were blocked by friction: confusing UX, slow pages, broken interactions, or unclear next steps.
This is why Digital Experience Analytics (DXA) — and more specifically page analysis — has become a critical capability for modern ecommerce teams.
What is Digital Experience Analytics (DXA)?
Digital Experience Analytics (DXA) is a category of tools and workflows designed to help teams understand how users experience a website or application — not just what they do, but how and why they behave the way they do.
DXA typically combines:
- Heatmaps (click and scroll behavior)
- Session replay
- Journey or path analysis
- Frustration signals (e.g. rage clicks, dead clicks)
- In some platforms, performance and technical context
What is page analysis?
Page analysis is the most practical way teams apply DXA.
Instead of asking, “How is the site performing overall?”, page analysis focuses on individual pages or page templates and asks:
- How do users engage with this page?
- Where do they hesitate or drop off?
- Where do they go next?
- What might be blocking them from converting?
This page-level lens is especially important in ecommerce, where most experiences are template-driven:
- Product detail pages (PDPs)
- Product listing pages (PLPs)
- Cart
- Checkout
- Landing pages tied to campaigns
A single issue on one template can quietly affect thousands of sessions.
.avif)
Page Analysis is Noibu’s DXA solution
Page Analysis is Noibu’s Digital Experience Analytics (DXA) solution, purpose-built for ecommerce.
Like traditional DXA tools, Page Analysis helps teams understand how users interact with a website through:
- Heatmaps
- Session replay
- Journey analysis
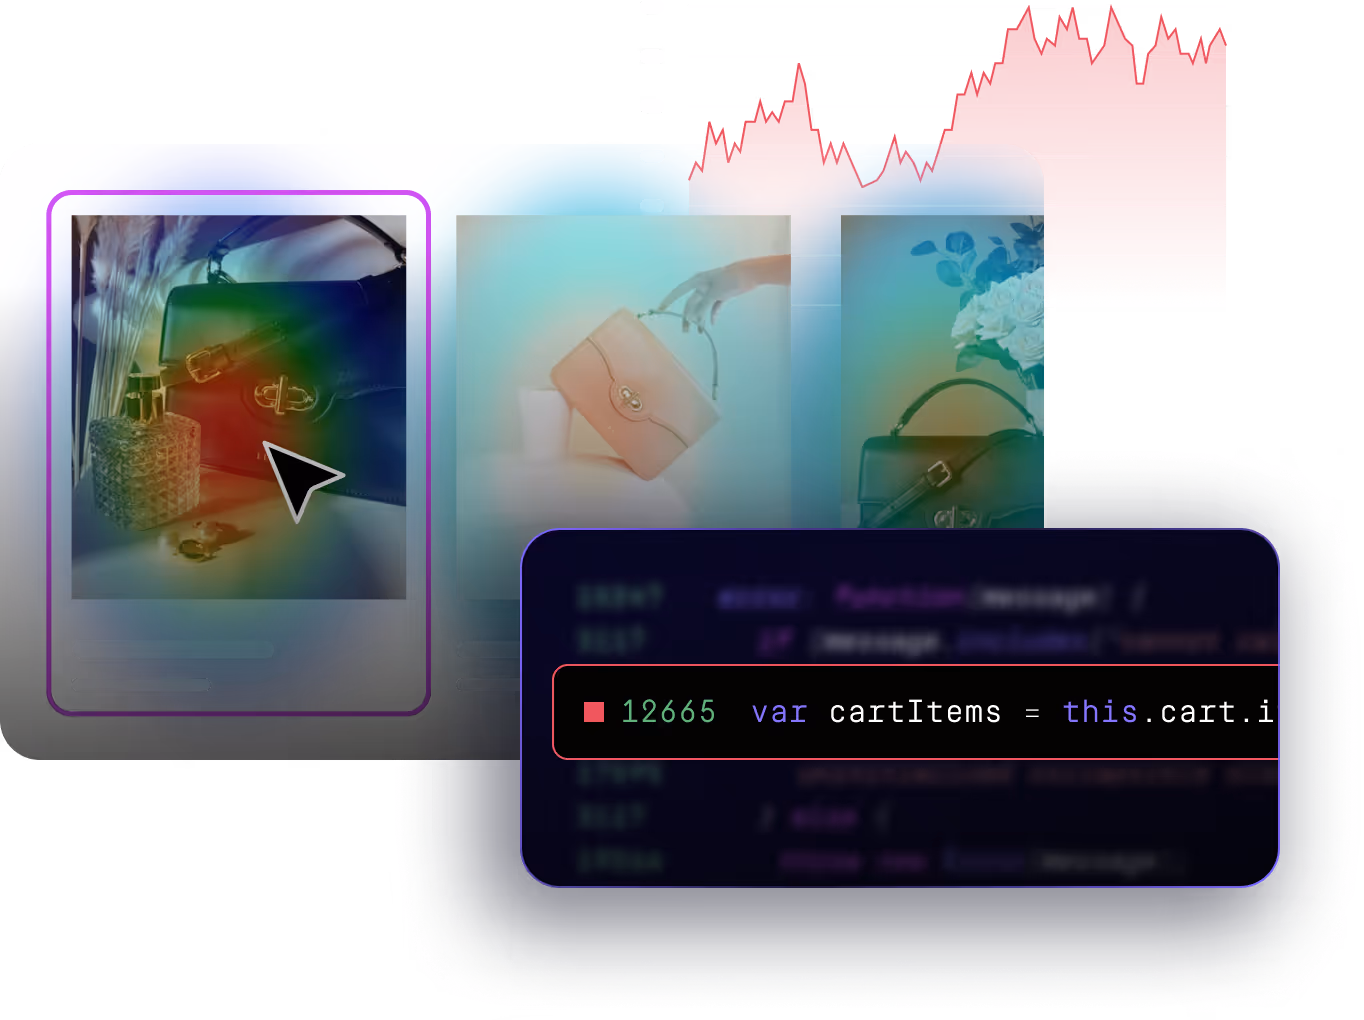
What makes Page Analysis different is how those behavioral insights are unified with technical and performance data in one workflow.
Instead of treating UX, errors, and performance as separate problems handled in separate tools, Page Analysis shows how they intersect — and how that intersection impacts conversion.
Why traditional analytics aren’t enough
Most ecommerce teams rely heavily on web analytics tools to understand performance. These tools are excellent at answering what happened:
- Traffic dropped
- Conversion rate declined
- A funnel step lost users
What they don’t explain well is why.
Analytics can tell you users aren’t clicking “Add to Cart”.
They can’t tell you:
- If users even saw the button
- If the button was unresponsive on mobile
- If the page was slow enough to kill intent
- If users were confused by nearby elements
DXA — and page analysis specifically — fills that gap.
The three layers of effective page analysis
Teams often struggle to get value from DXA because they only look at one layer of data at a time.
Effective page analysis connects three layers:
When these three layers are viewed together, patterns become obvious — and actionable.
A practical framework: the Page Analysis Loop
Page analysis shouldn’t be a one-off research project. The most effective teams treat it as a repeatable loop.
Step 1: Start with pages that matter
Focus on pages where small improvements compound:
- High-traffic landing pages
- PDP templates for top SKUs
- Cart and checkout
- Pages tied to paid acquisition
Step 2: Diagnose in order
Ask three questions, in sequence:
Are users engaging with what matters?
Use click and scroll maps to see whether key CTAs, content, and trust elements are being seen and used.
Are users getting lost or exiting unexpectedly?
Use journey views to understand where users come from, where they go next, and which exits correlate with drop-off.
Is something broken or slow enough to block intent?
Layer in page-level errors and performance trends to see whether UX friction is tied to reliability or speed issues.
Step 3: Create a prioritized fix queue
The output of page analysis should be:
- A short list of issues or opportunities
- Ranked by impact
- With clear ownership across Product, UX, Marketing, or Engineering
Step 4: Validate after shipping
After fixes or changes go live:
- Re-run page analysis
- Confirm engagement and conversion improved
- Catch regressions early
What good page analysis reveals (with examples)
1) Click friction
- Users rage-click a button that doesn’t respond
- Users click an image expecting it to open a gallery
- Users click “promo code” repeatedly and stall
Rage clicks are widely used as a frustration indicator because repeated clicking often means “I expected this to work and it didn’t.”
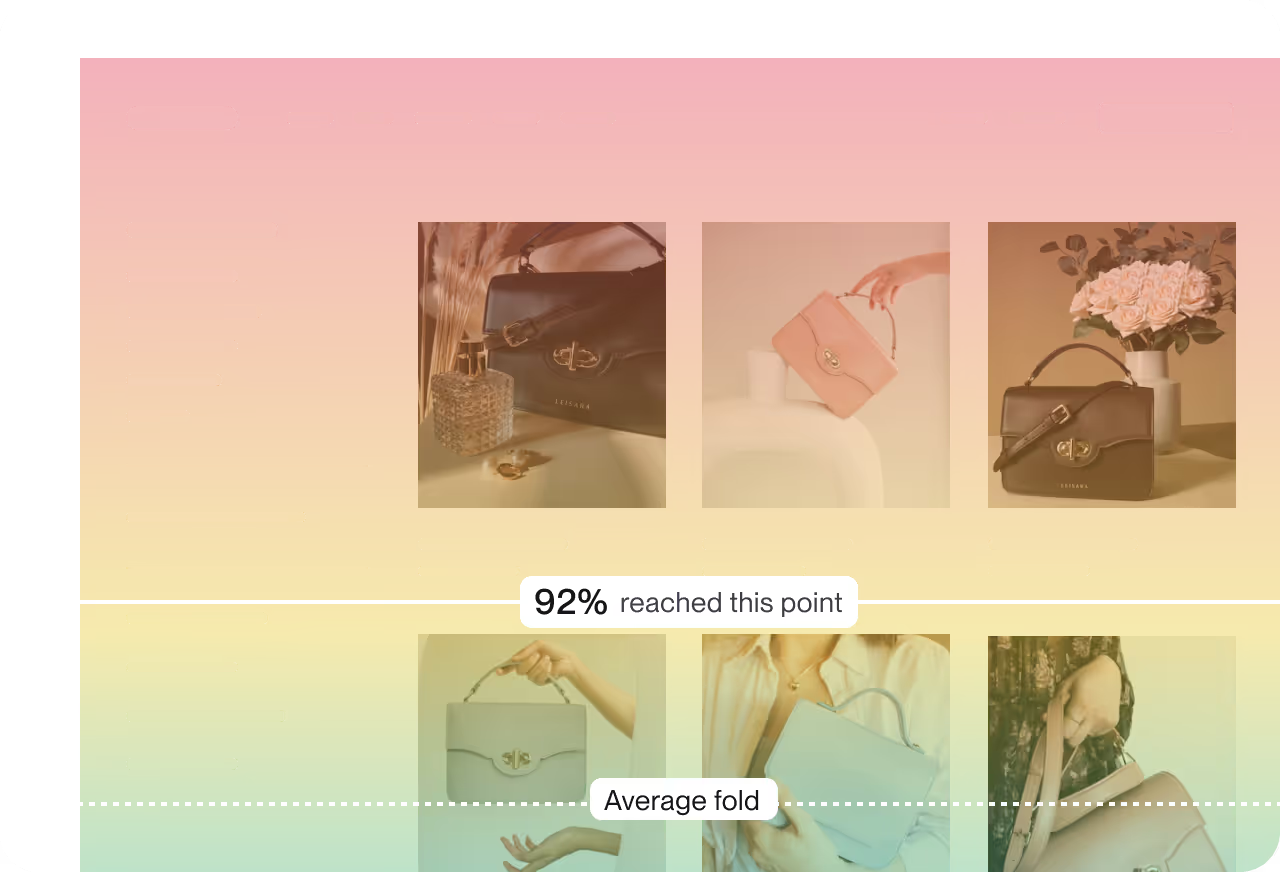
2) Scroll friction
- Users never reach shipping details (so they hesitate)
- Reviews are too far down to build trust
- Primary CTA is below the fold on mobile
3) Journey friction
- Users bounce between PDP ↔ collection pages because filters aren’t working
- Users exit from cart to FAQs because total cost isn’t clear
- Paid traffic enters on a page that doesn’t match intent
4) Technical and performance blockers
- Mobile-only errors on variant selection
- Slow LCP on image-heavy PDPs
- Checkout instability after a third-party update
Page Analysis vs traditional DXA tools
Most DXA tools focus primarily on behavioral signals.
Page Analysis takes the DXA foundation and extends it by design:
- Page-level errors alongside UX data
- Performance trends tied directly to engagement
- Ecommerce-specific context like page types and conversion paths
- A workflow designed for regular use, not one-off analysis
The result is DXA that helps teams move from insight to action faster — without needing a dedicated analyst.
What to look for in DXA page analysis (a checklist)
If you’re evaluating a DXA solution or building a workflow, prioritize:
- Page-level engagement: click + scroll maps
- Journeys / paths: inbound, outbound, and exit destinations
- Session replay: to confirm hypotheses quickly
- Frustration signals: rage clicks, dead clicks, u-turns
- Segmentation: device type + time windows at minimum
- Technical context: errors and performance trends tied to the page
- Template grouping: PDP/PLP/cart/checkout views (critical for ecommerce)
Closing perspective: page analysis is a conversion discipline
Modern ecommerce teams don’t need more dashboards — they need a reliable way to answer, every week:
- Where are shoppers dropping off?
- What experience signals explain it?
- What broke or slowed down?
- What should we fix next?
That’s what page analysis delivers when it’s done well — and why DXA has become foundational for ecommerce teams focused on turning traffic into revenue.