Ecommerce UX Analytics for Modern UX Teams


Ecommerce UX analytics measures how shoppers experience a store by combining behavior (clicks, scrolls, paths), experience signals (rage clicks, hesitation), and technical context (errors, speed), then ties friction to revenue. Noibu, AI for ecommerce operations, goes further: its AI agents turn that friction into page changes and tests your team approves.
For UX teams, it answers a question traditional analytics can't: not where shoppers go, but why they hesitate, struggle, or leave. This post explains what ecommerce UX analytics is, what it does that traditional UX tools don't, how UX teams at brands like Aeroflow Health, Harman, and Rvinyl use it, and what changes when AI agents act on what it finds.
- UX teams don't lack data. They lack context. Click maps and surveys show what users do, not how the journey feels or why it breaks.
- Ecommerce UX analytics combines three layers: behavior, experience signals, and technical context. Most tools deliver one.
- Friction is often technical, not visual. A slow PDP or a checkout JavaScript error looks like a design problem until you see what's underneath.
- The real measure of UX is conversion. When design work is tied to revenue, the roadmap debate shifts from taste to impact.
- Noibu is AI for ecommerce operations. Six supervised AI agents find what's broken, slow, or leaking revenue, build the change, and hand it back for your approval.
What visibility gap do UX teams inherit?
Most UX teams have a respectable stack: a heatmap tool, a session recorder, maybe a survey tool, and quantitative analytics from GA4. The team can see what users click, how far they scroll, and how a page ranks for engagement.
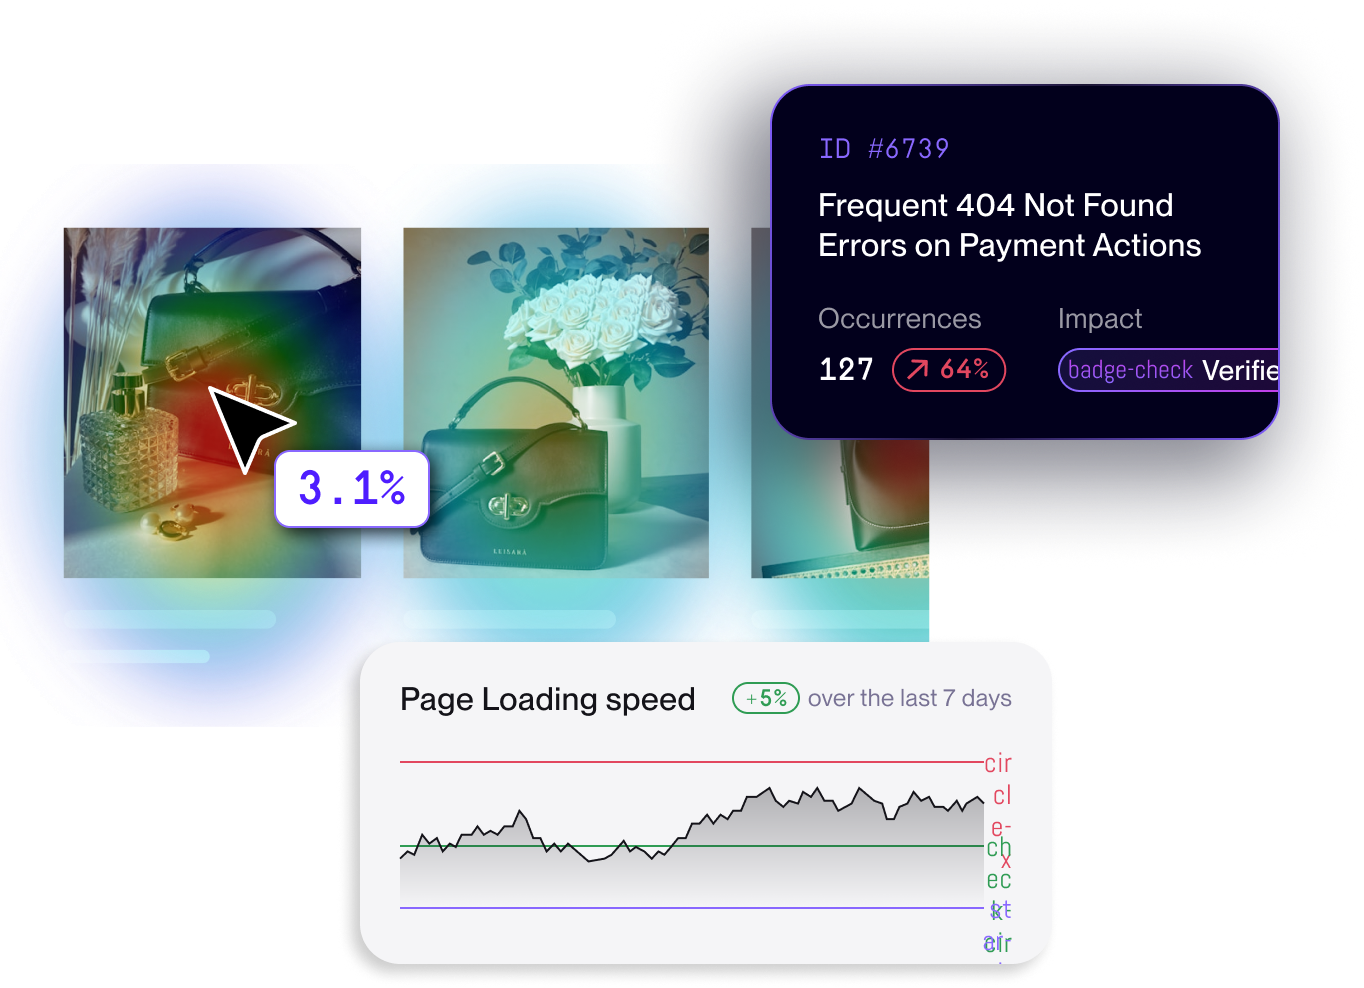
What that stack rarely shows is what the experience feels like to the shopper. Click data tells you a button was tapped. It doesn't tell you the shopper tapped it three times before it responded. Heatmaps show which sections draw attention. They don't show that the PDP took four seconds to load, or that the Add to Cart button threw a silent JavaScript error on Safari.
This is the gap UX teams inherit. Click data shows interaction, not experience. And when something breaks the experience, it usually doesn't look like a design problem at first. It looks like a conversion drop with no clear cause, so teams make and defend design decisions with the same surface-level data that created the ambiguity.
"Noibu helps us identify UX issues by surfacing sessions based on user behavior. Instead of sifting through quantitative data, we can watch real users and see their pain points in real life."
— Meredith Eads, Product Design Manager, Aeroflow Health
What does ecommerce UX analytics actually mean?
UX analytics gets used loosely. For ecommerce teams, it means measuring how shoppers move through a store, from landing page to PDP to cart to checkout, and connecting that behavior to conversion. It differs from generic UX research tools in two ways.
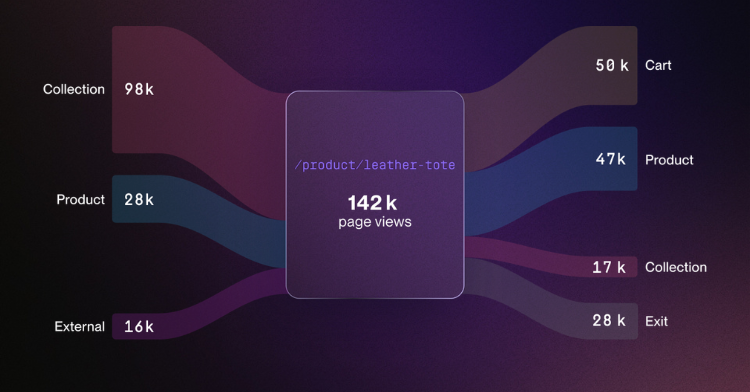
It's funnel-aware. A click on a homepage hero is different from a click on a checkout button, and a scroll drop-off on a PLP is different from one on a confirmation page. Ecommerce UX analytics is built around the PDP, PLP, cart, and checkout journey, not generic site analytics.
It ties experience to revenue. A rage click on a generic site is a usability signal. A rage click on a Place Order button is a measurable revenue loss. Ecommerce UX analytics shows what the friction costs, not just where it is.
That matters because UX teams are increasingly held to commercial outcomes. The discipline has moved from design improves usability to design improves conversion, and the tooling needs to match.
11%
Average order value increase at Rvinyl after surgically improving the PDP experience using aggregated heatmaps across thousands of product pages.
Source: Rvinyl customer outcome, Noibu
Which three layers do UX teams need to see together?
Useful ecommerce UX analytics combines three layers of signal. Most tools deliver one. The teams that drive the most measurable conversion lift work with all three.
1. Behavior: what shoppers do
Heatmaps, scroll maps, entry and exit flows, and aggregated click patterns across page groups like PDPs, PLPs, and checkout templates. The goal is to understand patterns across thousands of sessions, not the one session a designer just watched. Behavior alone is descriptive, not diagnostic: it shows what's happening, not why.
2. Experience: how it feels
Session replay and friction signals: rage clicks, dead clicks, repeated form submissions, hesitation, and scroll thrashing. These reveal frustration even when the shopper eventually converts, which makes them a strong leading indicator of repeat purchase and brand trust.
3. Technical context: what's happening underneath
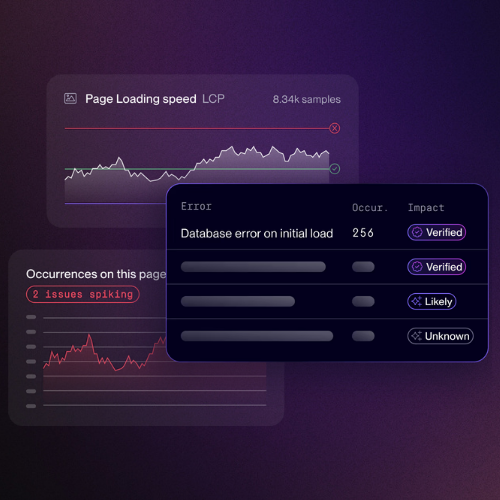
This is the layer most UX tools skip, and it's often where the cause of the friction lives. A Continue to Payment button that doesn't respond on the first click is frequently a JavaScript error, not a design flaw. A PDP image that loads slowly is a Core Web Vitals problem, not a layout issue. A checkout abandonment spike on Tuesday morning is often a regression from Monday's release.
Teams without technical context end up redesigning things that weren't broken and missing the changes that would move conversion. With it, they can tell a design problem from a code problem before spending a sprint on the wrong one.
"We've seen cases where users 'rage click' but still convert, which is not the experience we want. Being able to see that type of emotional behavior allows us to fix the friction and improve the journey for next time."
— Julian Charnas, Director of Digital Commerce, Harman Inc. (JBL)
How do UX teams tie design decisions to revenue?
The biggest shift in UX practice isn't a new method. It's the expectation that UX outcomes are measured in dollars. A 12% increase in scroll depth on a PDP is interesting, but it isn't budget-defensible. A lift in PDP-to-cart conversion after a gallery redesign is.
Ecommerce UX analytics closes that gap by attaching each friction point, and each change made to it, to a conversion outcome. When a team can show that surfacing and resolving high-priority issues saved $96,481 in four months, as Nudestix did, design decisions stop being subjective.
$96,481
Revenue saved at Nudestix in four months after surfacing and resolving 32 high-priority customer-impacting issues.
Source: Martine Knight, Sr. Ecommerce & Digital Manager, Nudestix
UX moves from we improved the experience to we recovered measurable revenue. That changes how the team is funded, how it prioritizes, and how stakeholders engage with design work.
Where do most UX analytics tools fall short for ecommerce?
Teams evaluating their stack tend to compare feature checkboxes: heatmaps, session replay, funnels. The surfaces look similar across vendors, so the differences only show up in production, when the team tries to act on the data.
| Capability | Generalist UX tool (Hotjar, FullStory, Contentsquare, Lucky Orange) | Noibu, AI for ecommerce operations |
|---|---|---|
| Session capture | Often sampled or quota-capped, so checkout-stage sessions can be missed | 100% session capture across desktop and mobile web, no sampling |
| Friction signals | Generic UX indicators (rage click, dead click) without ecommerce funnel context | Friction signals mapped to funnel stage (PDP, cart, checkout, payment) with revenue impact |
| Heatmaps & page analysis | Page-by-page heatmaps that are hard to aggregate across thousands of PDPs or PLPs | Aggregated heatmaps and scroll maps across page groups like PDPs, PLPs, and checkout templates |
| Technical context | Limited or none, so UX teams need a separate error or APM tool | Full technical detail in-session: errors, stack traces, Core Web Vitals, payloads |
| Revenue attribution | Manual case-by-case analysis that takes analyst time to quantify | Friction and issues automatically tied to revenue at risk by funnel stage |
| Setup & adoption | Steep learning curve; often becomes shelfware without dedicated analyst | Built for ecommerce teams; agents run in the console and in AI tools via Noibu MCP |
| What happens after friction is found | The team designs, builds, and tests the change | CRO and A/B Testing agents build the page change or experiment and hand it back for approval, then measure the result |
Generalist UX tools were built to serve many industries. They can be configured for ecommerce, but the funnel stages, revenue attribution, and technical context ecommerce teams need either don't exist or take significant analyst time to build. And all of them stop at the insight.
100%
of customer sessions captured by Noibu, with no sampling and no quota caps. Sampling-based tools have been reported to miss up to 75% of sessions once quota limits are reached.
Source: Noibu platform, 2026; LogRocket G2 user reports
What changes when AI agents act on UX data?
Even with all three layers in view, someone still has to decide what to change, design it, build it, test it, and check that it worked. For most UX teams, that's the real bottleneck.
Noibu is AI for ecommerce operations: a team of supervised AI agents that works from 100% capture of your store's sessions, errors, performance, and funnel data. The agents find the friction and issues costing the most revenue, build the change, and hand it back for human approval. Nothing ships until you say so, and every change is measured against its baseline.
Which Noibu agent helps the UX team?
The CRO and A/B Testing agents do most of the UX work, but all six agents use the same store data, so design, speed, and code problems each go to the right place:
- CRO Agent: finds underperforming product pages and rewrites them to convert better, with changes you can edit inline and publish to Shopify in one click.
- A/B Testing Agent: builds and runs experiments on friction points, measures lift, and reports the winning variant to ship.
- Performance Agent: measures Core Web Vitals from real shopper traffic, ranks the slowest page groups, identifies the cause, and stages the change.
- ADA Accessibility Agent: audits high-traffic pages against WCAG standards, stages accessibility changes for review, and re-audits after they go live.
- Bug Resolution Agent: ranks JavaScript, HTTP, and checkout errors by revenue at risk, traces the root cause to the codebase, and opens a pull request for engineering to approve.
- ROAS Agent: scores paid traffic on orders rather than clicks and recommends where to shift spend and targeting.
Your team can run the agents in the Noibu console, or through Noibu MCP from the AI tools it already uses, such as Claude, ChatGPT, Microsoft Copilot, GitHub Copilot, and OpenAI Codex.
What changes for the UX team?
Design moves from opinion to proof. Redesign debates shift from preference to revenue, backed by sessions, friction signals, and conversion deltas.
Research gets faster. Instead of recruiting users for a week-long moderated study, the team sees how thousands of real shoppers behave, and the agents surface the patterns that matter instead of leaving the team to sift for them.
The team stops fighting the wrong battles. A conversion drop on a redesigned PDP becomes diagnosable: design, performance, or a release regression. That prevents the most expensive UX mistake, rebuilding something that wasn't broken.
UX gets capacity back. When agents build the page changes and experiments and the team approves them, designers spend their time on judgment, not production.
"No other tool aggregates heatmaps like Noibu. Most of our customers come in on product pages (PDPs) rather than the homepage. Being able to see the journey across those thousands of specific pages allowed us to surgically improve the experience and increase our average order value by 11%."
— Philip Krynsky, CEO & Founder, Rvinyl
Frequently asked questions
What is ecommerce UX analytics?
How is ecommerce UX analytics different from heatmap tools like Hotjar?
What should a UX team measure on an ecommerce site?
How do UX teams prove the revenue impact of design changes?
Can AI agents act on UX analytics?
Where can my team use Noibu's agents?
Free website audit
See the friction your UX tools aren't showing you.
Noibu's free website audit runs our agents on your store and shows the friction, slow pages, and errors affecting real shoppers, ranked by revenue at risk, with what to change first.
Related topics:
- What is digital experience analytics (DXA)?
- The practical guide to page analysis and DXA for ecommerce
- Noibu vs Contentsquare
- The ecommerce site problem nobody talks about
About Noibu
Noibu is AI for ecommerce operations, the always-on optimization system that keeps online stores running at their best. A team of supervised AI agents finds what's broken, slow, or leaking revenue, does the work, and hands results back for human approval. Trusted by retailers like Free People, Guess, Liquid I.V., and Ariat.