
Visualize customer behaviour, user journeys, performance, and error data in one unified view.

Find the behavior behind every drop-off.

Learn how users interact with
any page
Visualize how customers engage and where they lose interest.
Heat maps and scroll maps show how visitors interact with page content and CTAs so you can optimize layout and flow.
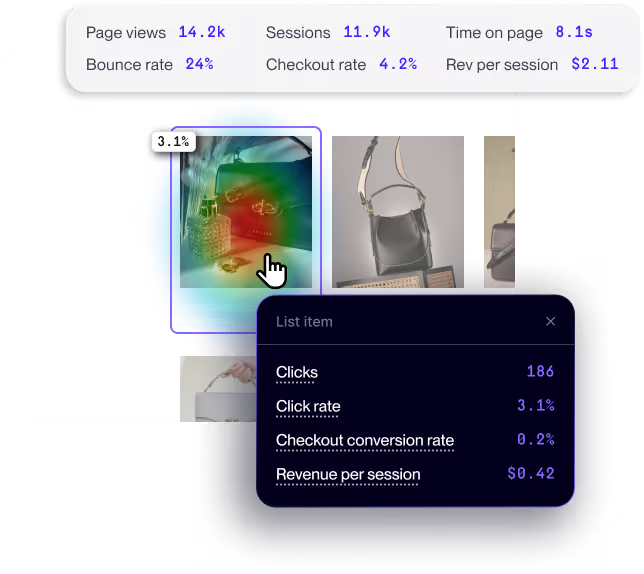
See what actually drives purchases, not just clicks
Every button, banner, and carousel tells a revenue story.
See click, conversion, and revenue metrics for any element on every page to optimize for orders over attention.
.avif)
Understand how customers navigate your site
See how shoppers move to and from key pages.
Map inbound and outbound traffic flows to reveal common user paths and identify where customers drop off.
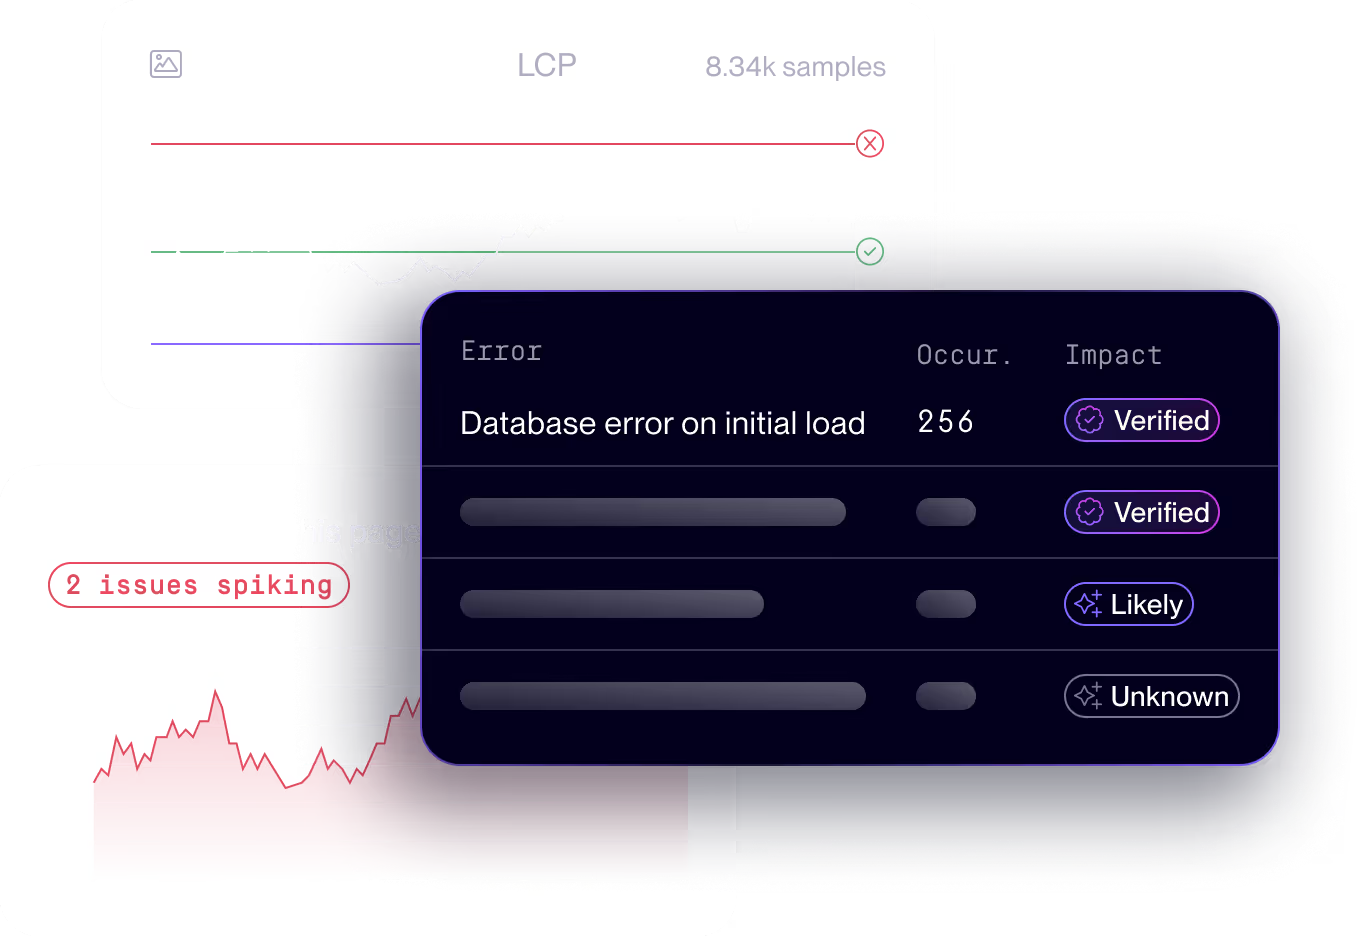
Spot issues and slowdowns
with context
Pair UX insights with technical data to uncover what blocks conversions.
Investigate page-level errors and performance issues that can prevent shoppers from completing a purchase.
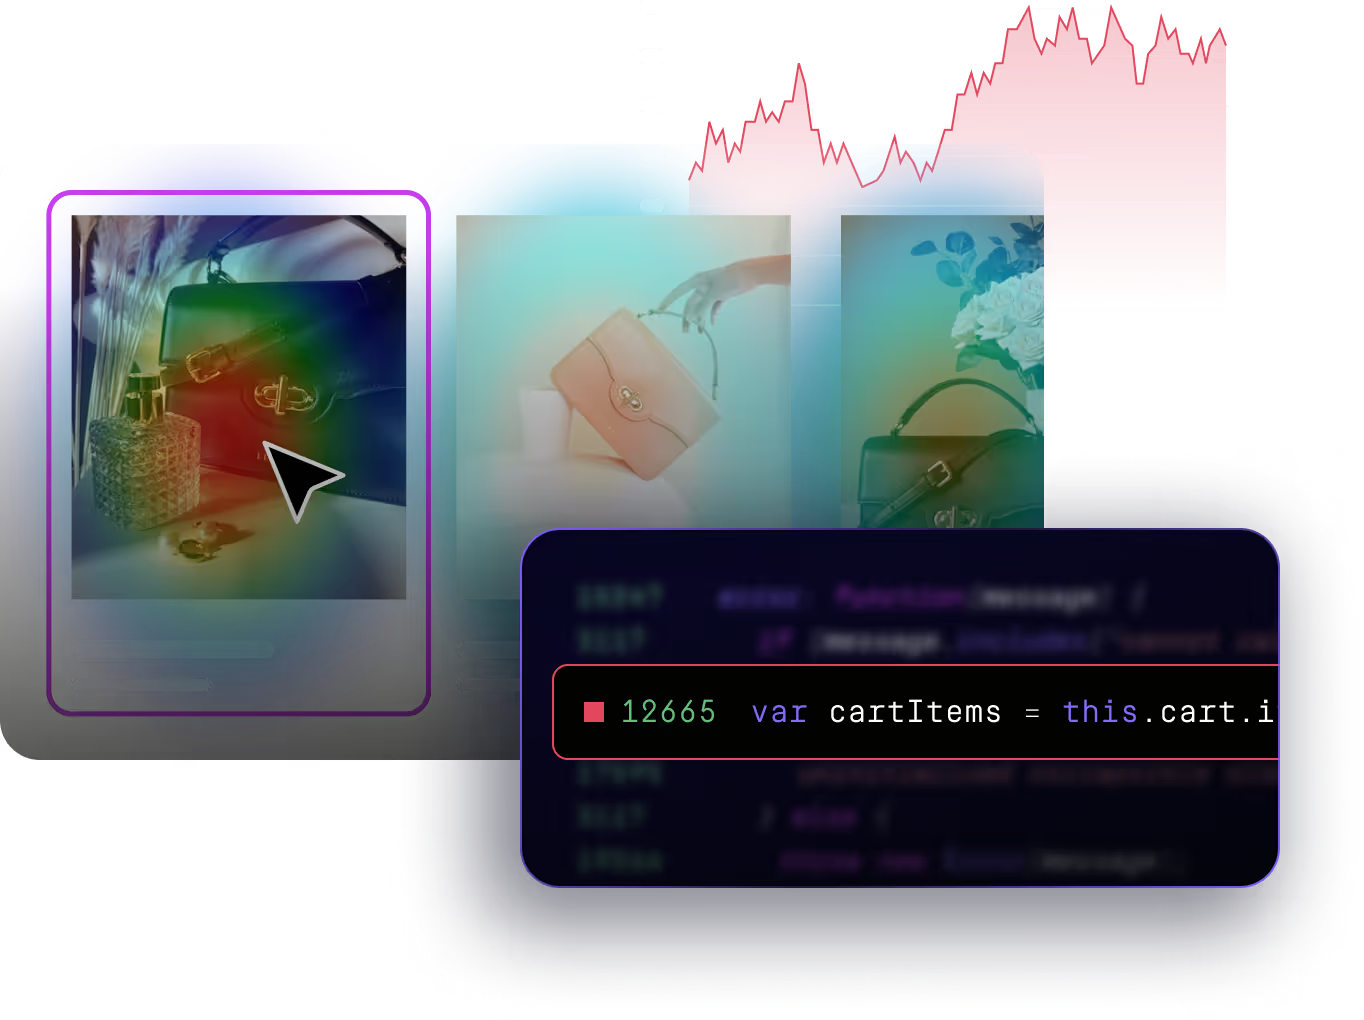
Connect UX, product, and tech teams with one tool
Unlock digital experience analytics powered by a complete ecommerce monitoring platform.
Enable teams to dig into broader site issues, session replays, and overall performance trends all in one tool.
Discover our other solutions
Issues & Alerts
Detect every issue ranked by business impact with the context to reproduce and debug fast.
Sessions
See how every shopper experienced your site, and every point of friction behind a lost conversion.
Performance Monitoring
Measure core web vitals from real customer traffic and quantify the cost of slow loading pages.
Release Monitoring
Automatically track how releases impact site health to validate quickly and ship with confidence.
Noibu AI
Ask our AI agents to find conversion opportunities on your store and easily act on what they find.
Wondering which pages need work?
Break down performance and engagement by funnel stage to find—and fix—where users fall off.