
How ecommerce brands use Noibu Performance Monitoring to recover revenue

.avif)
Executive summary
- Noibu analyzed over 35M real-user ecommerce sessions
- Identified key speed thresholds where bounce rates spike and conversions drop
- Enabled brands to recover thousands in lost revenue each month
- Helped teams resolve regressions faster, with greater ROI clarity
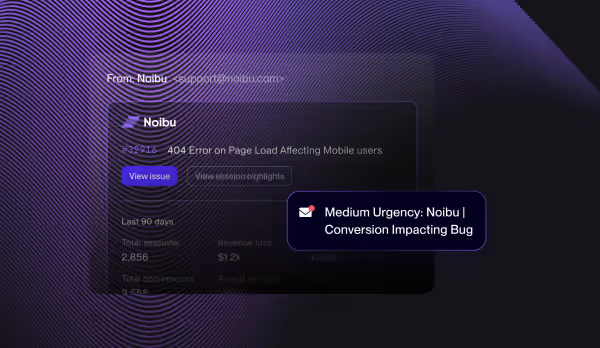
Check out our 2-minute video walkthrough of Noibu Performance Monitoring
Silent drain: Why your slow site is costing more than you know
Analyzing over 35 million real-user ecommerce sessions reveals a stark truth: site speed is a direct driver of revenue and conversion. Yet, for many ecommerce leaders, the performance issues quietly eroding their bottom line remain unseen, and unsolved.
Noibu Performance Monitoring closes this critical gap, transforming raw technical data into actionable business insights that drive measurable revenue recovery.

Key findings from Noibu’s 35M session analysis
- Under 1 second loading speed (LCP): ~30% bounce rate (best-case).
- 1–2.5 seconds: Bounce rate climbs toward 40%.
- 3–7 seconds: Plateau at 43–46% — users frustrated but still browsing.
- 8+ seconds: Bounce rates surge past 50% — users are actively abandoning.
Bottom line: Even small delays in load time have measurable business impact. The slower the site, the more revenue you silently lose.
How Noibu’s findings align with industry benchmarks
Broader industry research reinforces what Noibu sees in real-user data: speed isn’t just technical—it's commercial.
- Portent: Sites loading in 1 second convert 2.5× better than those taking 5 seconds. Conversion rates drop by 0.3 percentage points per extra second.
- Deloitte + Google: A 0.1 second improvement in load speed results in a +9.2% increase in average order value.
- QuintoAndar: Bounce rates fell 46%, session depth increased 87%, and conversions rose 5% after performance improvements.
Your slowest pages aren’t just UX problems—they’re your most expensive missed opportunities.
These benchmarks validate Noibu’s central premise: fixing performance isn’t just a dev task—it’s a revenue recovery strategy.
Why traditional performance monitoring falls short
Traditional performance tools measure speed, but they often fail executives by lacking crucial business context. They don't prioritize by financial impact, contextualize for ecommerce, or quantify the true cost of slowness. This is precisely the gap Noibu is built to close.
Ribble Cycles' CDO, Matthew Lawson, describes the chaotic reality of traditional site speed monitoring:
“Before Noibu, it was a bit of everything — and a lot of noise. We’d rely on gut feel to some extent: does the site feel fast? But beyond that, it was fragmented. I'd be checking Search Console for Core Web Vitals, running website speed tests, digging into browser dev tools, monitoring servers with New Relic, looking at edge performance through Cloudflare — basically just trying to cobble together a picture from lots of places that didn’t always agree with each other.”
— Matthew Lawson, CDO, Ribble Cycles

“The problem was, we were getting mixed messages. Some were useful, some weren’t, and most of it was hard to prioritise. We were constantly trying to reverse-engineer the issue — is this real, is it important, where’s it happening, and can we fix it? The biggest challenge was getting through the noise to figure out what actually mattered to the customer experience.”
— Matthew Lawson, CDO, Ribble Cycles
Legacy tools are often built for technical users, not revenue-focused leadership. This leads to:
- Reactive fixes: Identifying issues after they've impacted sales.
- Disconnected data: Inability to link performance drops directly to revenue loss.
- Siloed insights: Fragmented views that don't provide a unified business picture.
- Wasted resources: Misguided fixes and missed opportunities for high-impact improvements.
“I think quite often websites want to improve performance — of course they do — but trying to figure out where to start is daunting. Having a tool like Noibu Performance that prioritizes where your attention should be makes performance work a more approachable endeavor.”
— Jessica Scheck, Digital Ops Supervisor, Vermont Country Store
.png)
Why it matters: Performance improvements aren’t just technical wins—they’re business wins. Noibu provides actionable, customer-centric insights, so ecommerce teams can focus on what really moves the needle: faster experiences, fewer bounces, and recovered revenue.
Real results, real revenue: Customer success stories
Ribble Cycles: Precision fixes, business impact
After a major site speed overhaul, Ribble Cycles thought they were done — until Noibu flagged a tiny visual stability (CLS) layout shift caused by a delayed-loading country selector.
“We would never have spotted it. It was a 0.2 second shift, barely noticeable — but it was enough to drop our Core Web Vitals score from ‘Good’ to ‘Needs Improvement’. And once that slips, so does your SEO and conversion performance. Noibu helped us pinpoint exactly where [the issue] was happening and showed us live session replays so we could see it for ourselves. A simple fix once we knew — but without Noibu, we’d have missed it entirely and probably wasted time elsewhere.”
— Matthew Lawson, CDO, Ribble Cycles
.png)
Today, site speed is a key performance indicator (KPI) in Ribble’s board meetings, reflecting its direct impact on business goals. Noibu is the foundation of cross-team collaboration — helping dev, marketing, and product speak a common language of performance to drive shared revenue objectives.
Vermont Country Store: From guesswork to granular insight
Before Noibu, the VCS team relied on Lighthouse and educated guesses, often missing what customers were actually experiencing. Today, they fix what matters, faster.
“Currently the work that has come out of it includes: Updated file compression, adjustment of order of page load, and a new improved SSR structure. We also caught a login INP spike in the Performance tool recently, and we’ve found an issue with compounding login tagging within several scripts that we are now working to remedy. An issue that visibly impacted performance… would be a partial site outage from May 5th–7th… Our developer was able to use Noibu data to pinpoint where to look for the cause.”
— Jessica Scheck, Digital Ops Supervisor at Vermont Country Store
What 35 million sessions reveal: Your competitive edge
Our real-user analysis across 35 million ecommerce sessions reveals one consistent truth: when brands fix performance issues, business results follow. Noibu empowers ecommerce teams to move fast, prioritize what matters, and recover revenue that would otherwise be lost.
Here’s what leading ecommerce teams are achieving with Noibu:
- Small fixes, big impact: A mere 0.1 second improvement in load time can reduce bounce rates by up to 5.7% on high-traffic pages like product listings. When larger issues are addressed—like cutting loading speed from 9+ seconds to under 3—brands typically see bounce rate reductions of 10–25%.
- Measurable revenue recovery: Noibu helps brands recapture thousands in lost revenue every month by converting sessions that would have otherwise bounced due to performance friction.
- Faster regression response: Performance regressions—often invisible in traditional tools—are flagged in near real-time, allowing teams to resolve them in hours instead of days.
- Stronger team alignment: By tying performance issues directly to revenue impact, Noibu brings ecommerce, development, and product teams onto the same page, driving faster, more focused collaboration.
Why top brands aim higher than “good”: Google’s Core Web Vitals define the minimum thresholds for acceptable user experience—but they’re just a starting point.
Our internal benchmarking of mid-sized and enterprise ecommerce sites shows that the top 25% consistently outperform Google’s benchmarks, achieving LCP well under 2 seconds, minimal layout shifts, and fast interactivity—even under peak traffic.
For brands competing on speed, “good” isn’t good enough. Noibu provides the real-user visibility and business context required to reach—and sustain—elite ecommerce performance.
Beyond the surface: Common bottlenecks & Noibu’s real-user advantage
In our latest technical webinar, Noibu engineers highlighted the most common culprits behind persistent slow performance, often overlooked by traditional tools:
- Render-blocking JavaScript that delays critical content.
- Oversized or unoptimized hero images impacting initial load.
- Heavy, inefficient, or misplaced third-party plugins.
- Poorly implemented lazy loading that degrades user experience.
Unlike synthetic tools like Lighthouse, Noibu provides real-user performance data — offering actionable, real-world insights developers can trust to solve these complex issues.
Performance as a strategic business imperative
With Noibu, ecommerce leaders are reframing site speed not as a backend technical concern, but as a revenue-critical business initiative. The tangible outcomes for your organization are clear:
- Visibility: Gain clear insight into which performance issues are directly costing you money.
- Confidence: Prioritize the fixes that matter most, knowing they will deliver maximum ROI.
- Velocity: Detect and resolve performance regressions before customers even notice, protecting your brand and revenue.
Matthew Lawson, CDO of Ribble Cycles, offers his advice to those considering Noibu:
“Start. Just start. Noibu gives you the clarity to act with confidence and back your decisions with real data, not assumptions.”
— Matthew Lawson, CDO of Ribble Cycles
.png)
Unlock your site’s hidden revenue: The Noibu advantage
Ask yourself: How much is a slow site costing your business?
With Noibu Performance Monitoring, you can stop guessing and start fixing with precision. Convert lost sessions into measurable recovered revenue. Empower your ecommerce, development, and marketing teams with data that drives quantifiable business outcomes. Make performance a strategic competitive advantage, not a silent threat.
Book your performance impact analysis
Watch the deep dive webinar
.png)
.avif)