Best Ecommerce Page Analysis Tools for Conversion Optimization in 2026

Ecommerce page analysis is the practice of measuring how shoppers interact with specific page types on a retail site — product pages (PDPs), category pages (PLPs), cart, and checkout — using heatmaps, scroll maps, click data, and behavioural signals to identify what's driving or blocking conversion. The best ecommerce page analysis tools for conversion optimization aggregate behaviour across page groups rather than analyzing individual URLs one at a time, and connect what shoppers do on a page to whether they bought. This guide compares six leading platforms — Noibu, Contentsquare, Hotjar, Lucky Orange, Mouseflow, and Microsoft Clarity — on how each handles ecommerce page analysis, what makes them fit for retail teams, and where they fall short.
What ecommerce teams should expect from page analysis
Most page analysis tools were built for marketers running a small number of campaigns or landing pages. Drop a snippet, generate a heatmap, look for clusters. That's enough for a SaaS site optimizing a pricing page or a content site testing a header.
Ecommerce works differently. A typical mid-market retailer has hundreds of PDPs sharing a single template, dozens of PLPs across categories, and a checkout flow that spans multiple pages. Looking at a single URL's heatmap tells you almost nothing — the page that converts depends on the product, the audience, the device, and what came before it in the funnel.
Five things separate page analysis tools built for ecommerce from generalist heatmap platforms:
1. Page groups, not just individual URLs. Ecommerce teams need to see engagement at the template level — all PDPs, all PLPs, the entire cart flow — not just one page at a time. Without aggregation, the data is too thin and the workload is impossible.
2. Behavioural and technical context together. Click data shows where users interacted. Scroll depth shows what they paid attention to. But neither explains why they hesitated, struggled, or left. Pairing engagement with performance signals (Core Web Vitals, slow elements) and friction signals (rage clicks, dead clicks, form abandonment) closes that gap.
3. Connection to conversion and revenue. A page analysis tool that surfaces a heatmap pattern is interesting. One that says "this PDP template is converting 30% below benchmark and the issue appears to be below-the-fold engagement" is useful.
4. Funnel awareness. Analyzing a checkout page is not the same problem as analyzing a PDP. The metrics that matter, the friction patterns that matter, and the right scroll behaviour all change by funnel stage. The tool needs to know which page type it's looking at.
5. Cross-functional usability. Page analysis is most powerful when UX, product, engineering, and CRO teams share the same view. Tools that require an analyst layer slow down decisions and end up underused.
The 6 best ecommerce page analysis tools in 2026
1. Noibu
Best for: Ecommerce and digital teams at mid-market and enterprise retailers who need page-level CRO insight aggregated across PDPs, PLPs, cart, and checkout — with behaviour, performance, and technical context in one view.
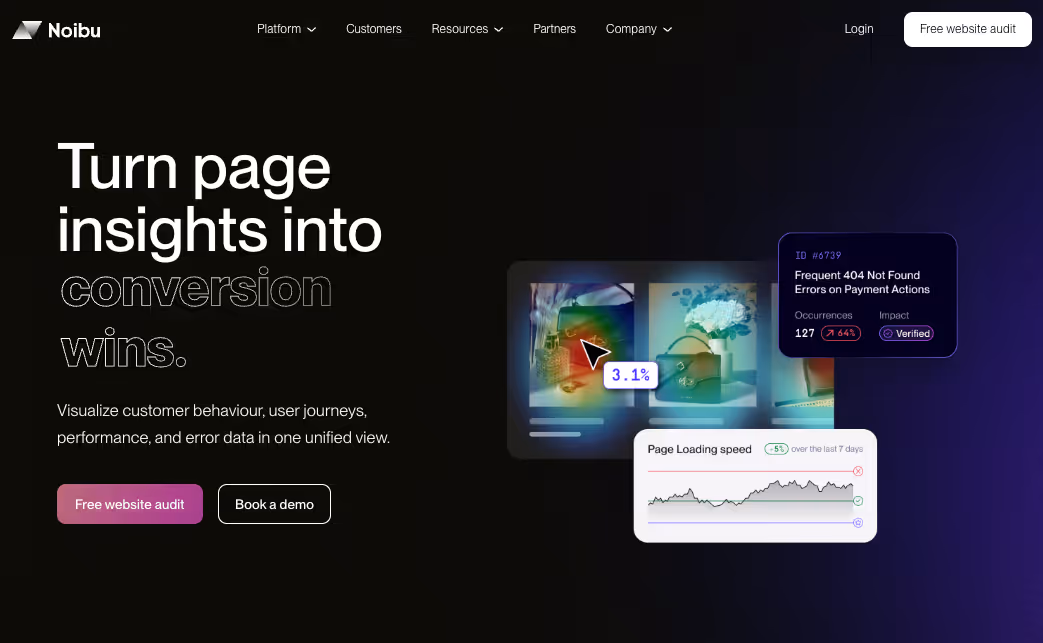
Noibu is the only platform in this comparison built specifically for ecommerce. Page Analysis is one product line inside a broader ecommerce analytics and monitoring platform, which means every heatmap, scroll map, and click pattern is enriched with the data ecommerce teams actually need: page type, funnel stage, performance metrics, and the technical issues affecting that page right now.
What sets Noibu apart for ecommerce page analysis:
- Aggregated page-group analysis. Heatmaps and scroll maps roll up across page templates — every PDP, every PLP, every checkout step — rather than forcing teams to analyze individual URLs one at a time.
- Clicks, scrolls, and entry/exit flow patterns at the page or page-group level, so UX teams can see how shoppers move through the funnel and which pages create the biggest drop-offs.
- Engagement + technical context together. Page Analysis sits alongside Performance Monitoring, Session Replay, and Issues & Alerts, so when a page is underperforming, teams can immediately see whether the cause is design, behaviour, slow LCP, or a JavaScript issue.
- Conversion-linked. Page-level engagement is tied to actual funnel outcomes, so improvements aren't guesses — they're hypotheses backed by what shoppers actually did before and after.
- Built for cross-functional ecommerce teams without an analyst gating insight. UX, product, and CRO leads can use the same view.
"No other tool aggregates heatmaps like Noibu. Most of our customers come in on product pages rather than the homepage. Being able to see the journey across those thousands of specific pages allowed us to surgically improve the experience and increase our average order value by 11%."
— Philip Krynsky, CEO & Founder, Rvinyl
2. Contentsquare
Best for: Large enterprises with dedicated analyst teams running cross-industry experience programs.
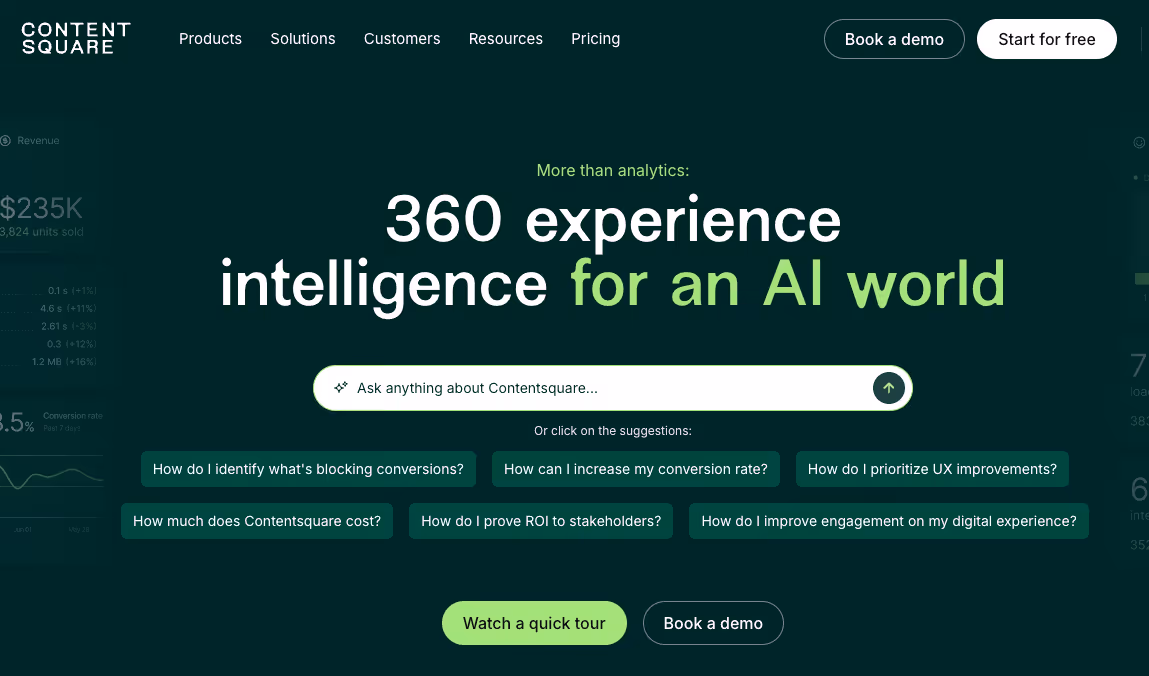
Contentsquare is a category leader in zone-based behavioural analytics. Its heatmaps are among the most sophisticated in the market, breaking pages into defined zones and surfacing engagement, exposure, attractiveness, and hesitation metrics for each. For large retailers with mature analytics teams, the depth is genuinely valuable.
Where it falls short for most ecommerce teams: Contentsquare is a generalist platform serving automotive, financial services, SaaS, and retail with the same product. Page analysis happens within a session-centric workflow, and ecommerce-specific context — funnel stage, payment failures, cart abandonment patterns — has to be configured rather than coming native. Revenue impact is measured case by case rather than rolled up automatically across page groups. Implementation is heavy, pricing is enterprise-tier, and the learning curve usually means an analyst sits between the data and the team making decisions.
3. Hotjar
Best for: Small businesses and content sites running lightweight UX research alongside surveys.
Hotjar built the consumer category for heatmaps and surveys. It's affordable, easy to set up, and widely adopted across SMB. For a small ecommerce site running occasional page-level CRO experiments, it can be a sensible starting point.
Where it falls short for ecommerce at scale: Hotjar's heatmaps work at the individual URL level, which means aggregating insight across hundreds of PDPs or PLPs is impractical without exporting and stitching the data manually. The tool was built for general UX research across SaaS, transportation, and finserv — not for ecommerce — so the friction signals it surfaces aren't tied to PDP, cart, or checkout context. There's no Core Web Vitals monitoring, no funnel-stage awareness, and no connection between page-level engagement and revenue. For mid-market and enterprise retailers, Hotjar usually ends up as one of several tools rather than a primary CRO platform.
4. Lucky Orange
Best for: SMB ecommerce stores on Shopify and similar platforms running their first heatmap and session replay program.

Lucky Orange is one of the few page analysis tools that explicitly markets itself to ecommerce. Pricing is accessible, the Shopify app is well-integrated, and the tool combines heatmaps, recordings, and live chat in a single product. For small Shopify merchants getting started with CRO, it's a reasonable choice.
Where it falls short for mid-market and enterprise retailers: Lucky Orange is built for behavioural insight, not technical or performance context. It shows what shoppers did, but not whether a slow LCP, a JavaScript issue, or a third-party script was the underlying cause of a drop-off. Page analysis is page-by-page rather than aggregated across page groups, which limits its usefulness for retailers with large catalogues. As stores scale beyond a few hundred SKUs and a single store template, the gaps usually drive teams toward a more complete platform.
5. Mouseflow
Best for: Mid-market teams looking for heatmaps, funnels, and form analytics in a single mid-priced tool.
Mouseflow is a well-rounded behavioural analytics platform with credible heatmaps, scroll maps, conversion funnels, and form analytics. It's commonly adopted by ecommerce teams who've outgrown Hotjar but aren't ready for Contentsquare. Pricing sits comfortably in the mid-market range, and the platform handles the basics competently.
Where it falls short for ecommerce: like most tools in this list, Mouseflow is industry-agnostic. It doesn't model ecommerce funnels natively, doesn't aggregate analysis at the PDP or PLP template level, and doesn't connect engagement patterns to underlying performance or technical signals. Friction signals exist (rage clicks, click error rate) but live separately from the deeper context that explains why friction happened. Teams using Mouseflow alongside an APM tool, an error monitor, and a session replay platform will recognize the workflow tax of stitching insight together.
6. Microsoft Clarity
Best for: Teams who want free heatmaps and session recordings to validate a CRO program before investing.
Microsoft Clarity is free, set up in minutes, and has rapidly become a default in the heatmap conversation. For teams who want to introduce page-level behavioural data into a CRO program without a budget conversation, Clarity is a credible entry point.
Where it falls short for ecommerce: Clarity is a horizontal product designed for any website, not for ecommerce specifically. There's no funnel-stage awareness, no page-group aggregation across PDP or PLP templates, no connection to performance metrics or technical issues, and no revenue mapping. The data is useful at a surface level but stops short of the diagnostic depth that ecommerce CRO programs need to identify why a page isn't converting. Many teams use Clarity alongside other tools for this reason — it's an input, not a system of record.
Page analysis tool comparison: feature by feature
How to choose the right page analysis tool for your ecommerce site
The choice usually comes down to three questions.
How big is your catalogue, and can a tool handle it? If a retailer has 50 SKUs across one template, individual-URL heatmaps are fine. If a retailer has 5,000 SKUs across PDP, PLP, and checkout templates, the only realistic way to find patterns is page-group aggregation. Tools that don't aggregate force ecommerce teams to either ignore most pages or hire analysts to stitch the picture together manually.
Will the tool tell you why a page isn't converting — or just that it isn't? A heatmap showing low engagement below the fold is a clue. It's not a diagnosis. Did shoppers not scroll because the design didn't pull them, because the page loaded slowly, or because a JavaScript issue broke the gallery? Behavioural data alone can't answer that. The platforms that connect engagement to performance and technical context turn page analysis from observation into action.
Will UX, product, and engineering all actually use it? The most expensive page analysis tools in the world become shelfware when only an analyst can interpret them. The teams running effective CRO programs use platforms where a UX designer can spot a pattern, a product manager can validate it against funnel data, and an engineer can confirm whether something on the page is technically broken — all in the same view.
"We've seen, through Noibu, some cases where people will rage click but they'll still convert, and that's not a great experience. Being able to see that type of emotional behaviour has been really helpful. We're able to see it, fix it, and improve it for the next time."
— Julian Charnas, Director of Digital Commerce at Harman Inc. (JBL)
Related topics:
- The practical guide to Page Analysis and Digital Experience Analytics for ecommerce
- Noibu vs. Lucky Orange: what sets the complete ecommerce experience analytics platform apart
Stop guessing at why pages aren't converting
Page analysis is most valuable when it tells ecommerce teams what to do, not just what shoppers did. Heatmaps and scroll maps are necessary, but they aren't enough — without engagement aggregated across page groups, without performance and technical context, and without a connection to revenue, the data is interesting rather than actionable.
Noibu's Page Analysis is part of a complete ecommerce analytics and monitoring platform that gives UX, product, and CRO teams a single view of how every page template is performing — behaviourally, technically, and in revenue terms.
CTA: Free website audit → See exactly which page templates are underperforming on your site, and what's driving the gap. Noibu will run a complimentary audit and show you where engagement, performance, and conversion are breaking down on your top pages — with no demo required to see results.
About Noibu
Noibu is the leading ecommerce analytics & monitoring platform, purpose-built to help retailers protect and grow online revenue. By unifying site monitoring, experience analytics, and conversion growth opportunities in a single pane of glass, Noibu captures the most important end-to-end shopping data, without the complexity of traditional analytics tools.
Noibu surfaces critical site errors, performance issues, and customer journey friction that block conversions, then ties every insight directly to business impact, session replays, and full technical context. This makes it easy for ecommerce teams to understand why things are happening and what to prioritize, without dedicated analytics headcount.
The result: faster decisions, better collaboration across teams, optimized customer experiences, and revenue growth.
.avif)