What Is Digital Experience Analytics (DXA)? A Guide for Ecommerce

Digital experience analytics (DXA) is a category of tools and workflows that help teams understand how and why users experience a website or app, rather than only what they did. It typically combines heatmaps, session replay, journey or path analysis, and frustration signals such as rage clicks and dead clicks, and in some platforms adds performance and technical context. Its purpose is to connect user behaviour to experience quality and business outcomes, especially conversion.
Most teams have plenty of data about what happens on their site and very little about why. Web analytics shows traffic, conversion, and where a funnel loses people. It rarely explains the reason: whether a shopper even saw the button, whether it worked on their phone, whether the page was slow enough to kill intent, or whether something nearby confused them. Digital experience analytics exists to answer that “why,” and for ecommerce teams it has become one of the most useful categories of tooling for protecting conversion.
What digital experience analytics (DXA) is
Digital experience analytics is a category of tools and workflows designed to help teams understand how users actually experience a website or application, not just the actions they take but the quality of the experience around those actions. Where conventional analytics counts events, DXA reconstructs and interprets them, so a “drop-off” becomes a story you can watch and explain.
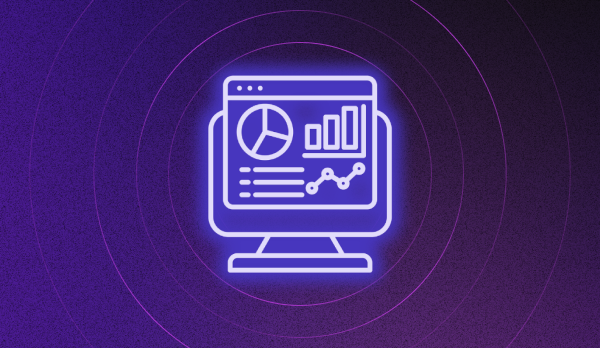
In practice, DXA platforms combine several capabilities into one view. The common building blocks are heatmaps, session replay, journey analysis, and frustration signals, and the better ecommerce-oriented platforms add the technical layer underneath them.
The building blocks of DXA
The core distinction: DXA vs. traditional web analytics
The two are complementary, not interchangeable. Web analytics is excellent at the quantitative “what”: sessions, conversion rate, funnel step completion, channel performance. It is the right tool for measuring outcomes and spotting that something changed.
What it cannot do is explain the cause. Analytics can tell you fewer shoppers clicked “Add to Cart” this week. It cannot tell you whether the button was below the fold, unresponsive on a particular phone, slow to load, or crowded by a competing element. DXA fills exactly that gap, which is why most teams run both: analytics to know what moved, DXA to understand why and decide what to do about it.
Why DXA matters for ecommerce specifically
Ecommerce teams rarely have a traffic problem. They have a conversion-throughput problem: they spend heavily to bring shoppers in, and most of those sessions never become revenue. Some of that is normal browsing, but a meaningful share is shoppers who intended to buy and were blocked by friction, confusing UX, a slow page, a broken interaction, an unclear next step.
Ecommerce is also overwhelmingly template-driven. PDPs, PLPs, cart, and checkout each repeat across thousands of sessions, so a single issue on one template quietly scales into a large revenue leak. That combination, expensive traffic and high-leverage templates, is what makes DXA, and page-level analysis in particular, so valuable for retail. For a hands-on method, see our practical guide to page analysis and DXA for ecommerce.
What to look for in a DXA tool for ecommerce
If you are evaluating the category, the differentiator is not whether a tool has heatmaps and replays (most do) but how much of the picture it connects. For ecommerce, prioritize: page-level engagement (click and scroll maps); journeys and exit paths; session replay to confirm hypotheses fast; frustration signals; segmentation by device and time; template grouping for PDP, PLP, cart, and checkout; and crucially, the technical and performance context tied to each page. The last one is what most general DXA tools leave out, and it is what turns “this page underperforms” into “this is the error costing the most, here is the session, here is the fix.”
Where Noibu fits
Noibu is an ecommerce analytics and monitoring platform, and its Page Analysis capability is its DXA solution, built specifically for retail. It brings the standard DXA building blocks (heatmaps, scroll maps, session replay, journey analysis) into one workflow, and unifies them with the technical and performance layer most general DXA tools omit: page-level errors, performance regressions, and the revenue impact of each. Instead of treating UX, errors, and performance as three separate tools, it shows where they intersect and quantifies what that intersection costs, so the output is a prioritized, fixable queue rather than another dashboard.
“Noibu has been integral in delivering insights to site speed, which has been really helpful to optimize our user experience, make sure that we're converting users once we have them, specifically around cart and checkout.”
— Meredith Eads, Product Design Manager at Aeroflow Health
Related topics
- How do you do page analysis in practice?
- What is Noibu Page Analysis?
- What is ecommerce site health monitoring?
Turn experience data into a fix list
DXA is only as useful as the action it drives. The teams that get the most from it are the ones whose tooling connects behaviour to the technical cause and the revenue at stake, so every week ends with a ranked list of what to fix rather than another set of charts. That connection is what Noibu's Page Analysis is built to deliver.
Get a free website audit to see the friction and revenue impact on your own pages, or request a demo of Page Analysis on your store.