Digital Experience Analytics for Ecommerce, Explained

Digital experience analytics (DXA) is the practice of understanding why shoppers behave the way they do on your site — where they hesitate, what frustrates them, and what makes them leave — rather than just counting what they did. For ecommerce teams, it’s the difference between knowing your conversion rate dropped and knowing the exact moment on the page that caused it.
Traditional web analytics is very good at counting. It will tell you how many sessions reached checkout and how many converted. What it cannot tell you is why the other shoppers left — and on an ecommerce site, that “why” is where revenue is won or lost.
What is digital experience analytics?
Digital experience analytics is a category of tools that observe and explain real user behaviour on a website or app. Where web analytics aggregates events into metrics, DXA reconstructs the experience: it shows you how far people scroll, what they click and ignore, where they get stuck, and how they move through the journey. The goal isn’t more numbers — it’s the reason behind the numbers you already have.
What digital experience analytics includes
DXA isn’t a single feature — it’s a set of capabilities that together reconstruct the shopper experience:
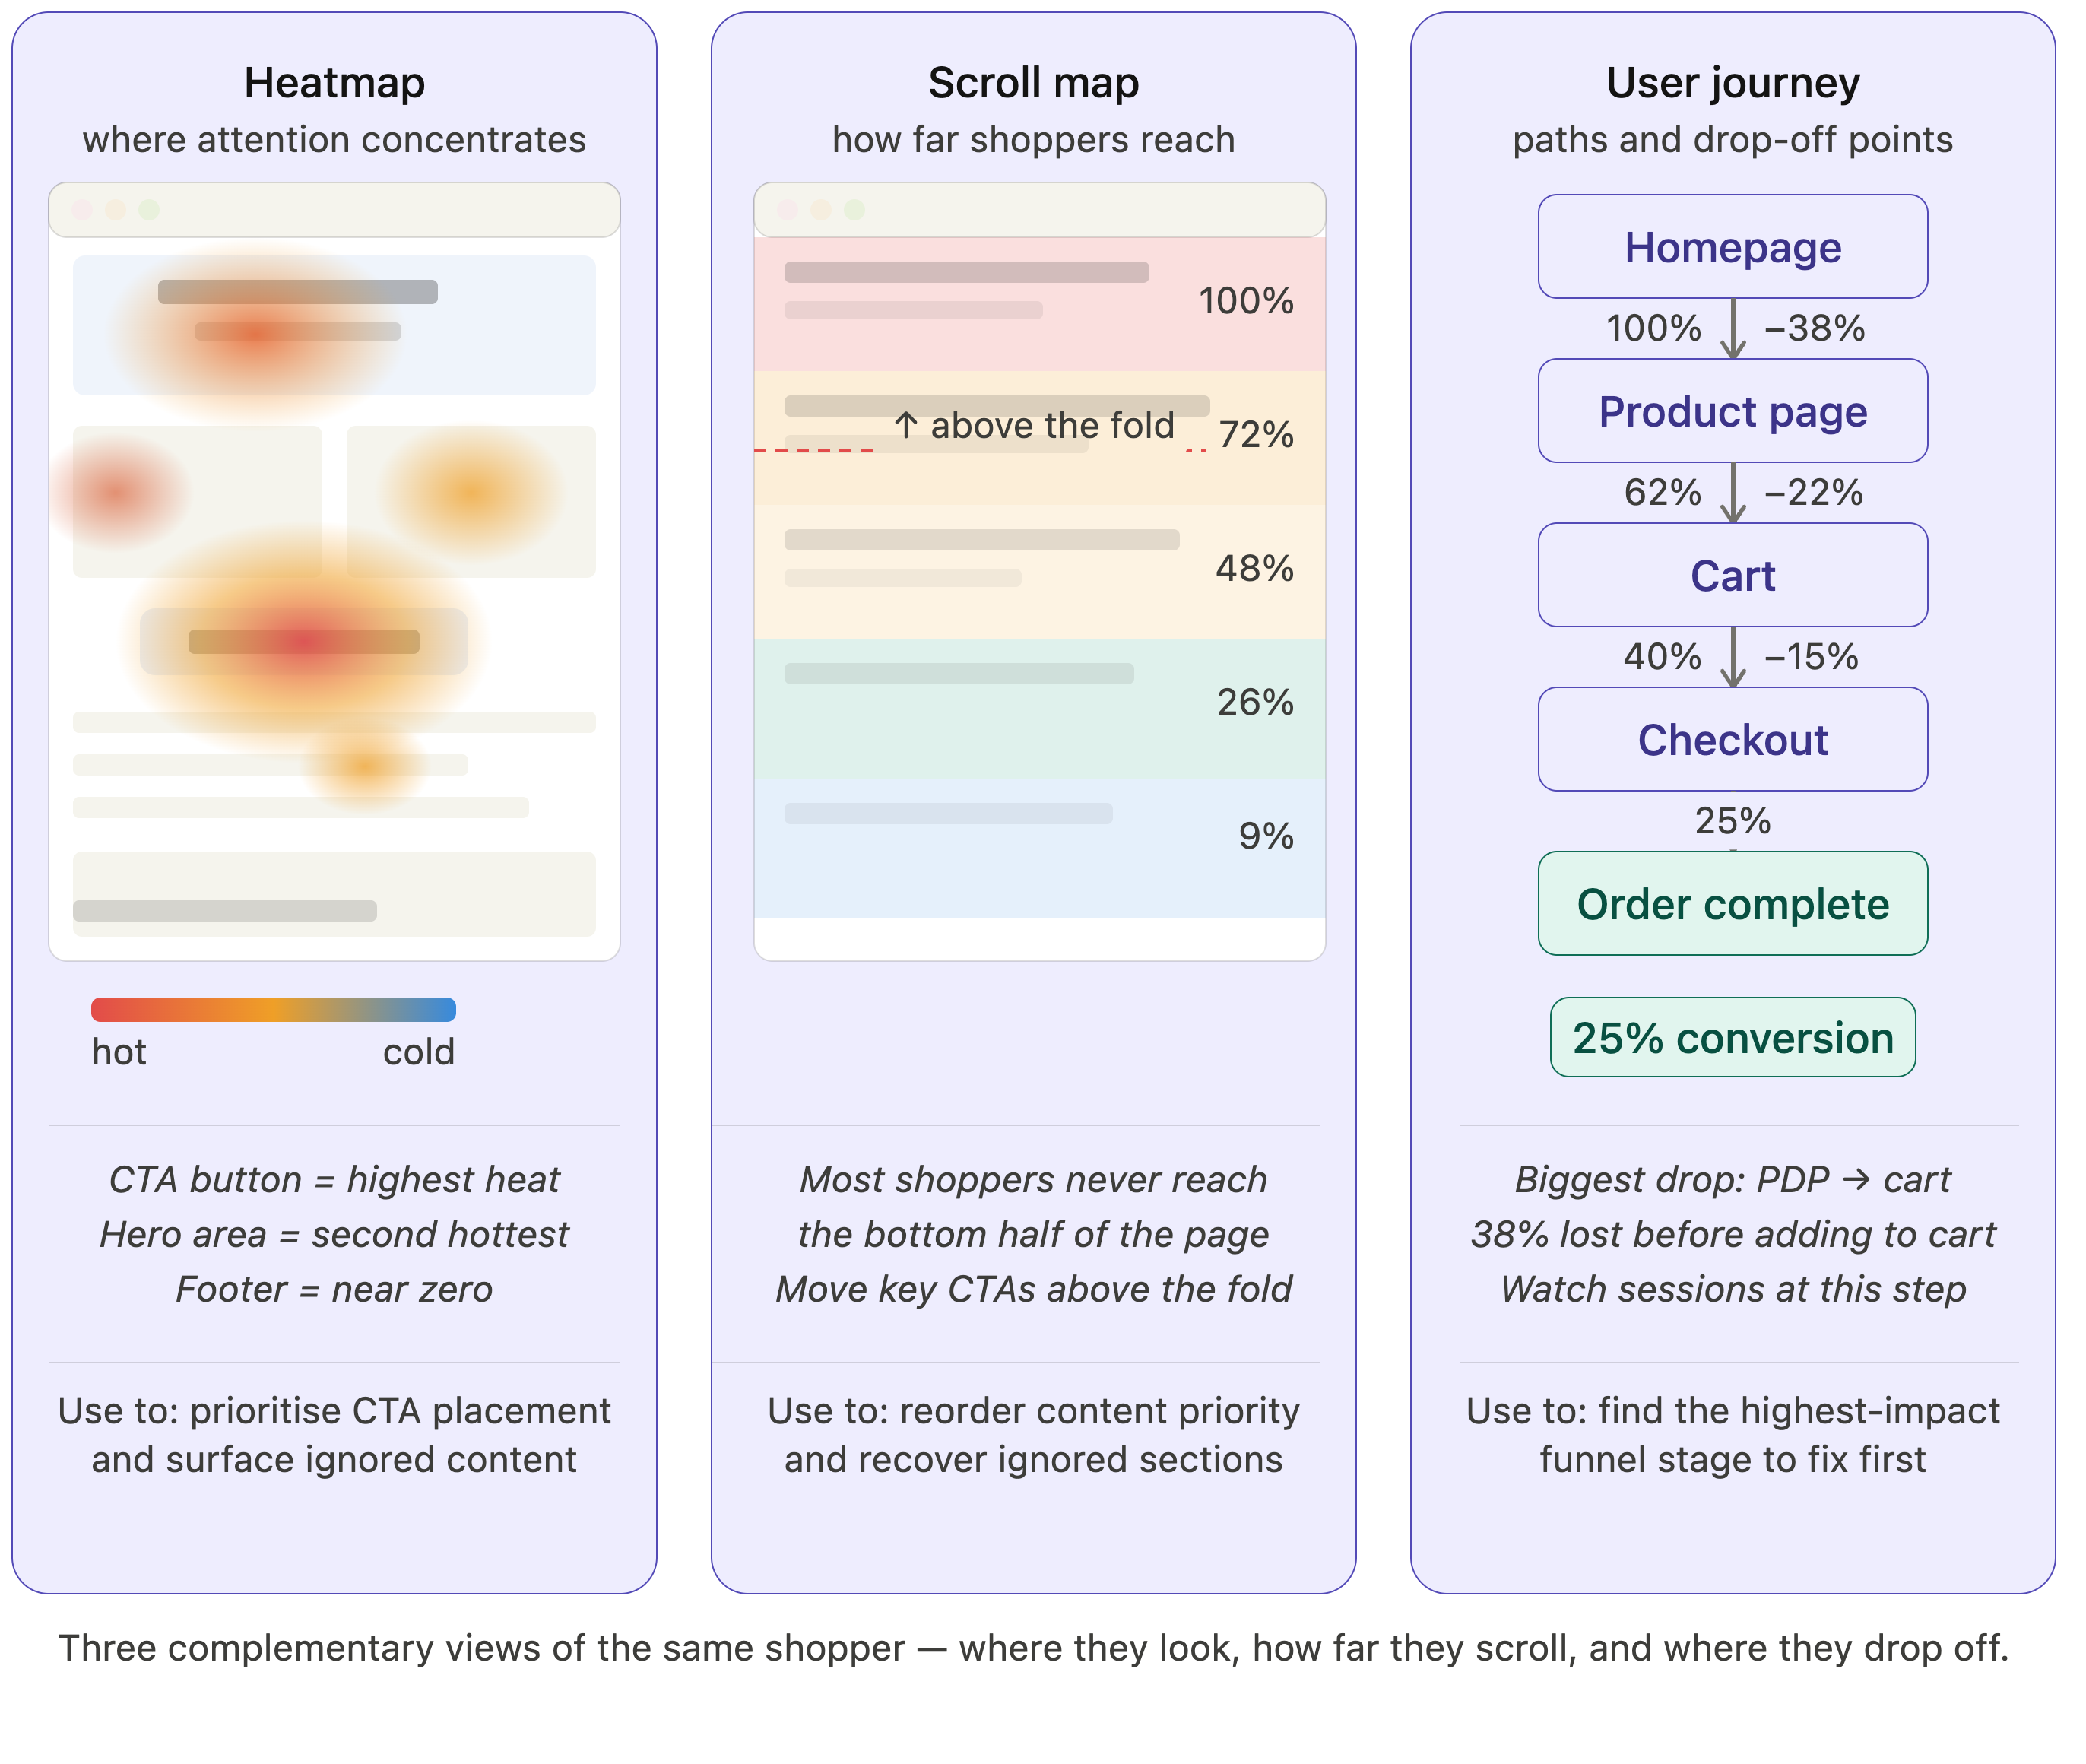
Heatmaps and scroll maps show where attention concentrates and how far down a page shoppers actually get. Click and tap maps reveal what people interact with — and what they try to tap that isn’t clickable. Session replay reconstructs individual journeys so you can watch the real experience. Journey and funnel analysis shows where shoppers move and where they drop. And frustration signals — rage clicks, dead clicks, erratic movement — surface the silent struggles that never trigger a technical error.
Why ecommerce teams need digital experience analytics
Every business benefits from understanding its users, but ecommerce raises the stakes. On a retail site, the experience is the storefront, and every point of friction has a price. A confusing size selector, a scroll that hides the “add to cart” button, a checkout field that fights mobile shoppers — each one converts measurable traffic into measurable lost revenue.
Web analytics will show you the dip. It won’t show you that the dip is a filter on the collection page that resets on every tap. DXA closes that gap: it turns “conversion fell 4% on mobile” into “mobile shoppers can’t complete the size picker, here’s the session.” For teams whose revenue depends on the funnel, that’s not a nice-to-have — it’s how you find the money you’re leaving on the table.
What to look for in a DXA tool for ecommerce
The established digital experience analytics tools — Contentsquare, FullStory, Hotjar, Quantum Metric — all capture behaviour, but they differ on the things that matter most for a retail team. Four are worth pressing on:
Full capture, not sampling. Some tools record only a fraction of sessions to control cost. For diagnosing experience problems, the session you most need is often the rare, broken one — exactly what a sample drops. Look for 100% capture.
Low setup and tagging burden. Several DXA platforms depend on manual “zoning” or event tagging, which is tedious to configure and breaks when your site changes. The less your team has to instrument by hand, the faster you get reliable insight.
Behaviour tied to a cause, not just a heatmap. A pretty heatmap that can’t tell you whether a drop is a design choice or a broken script leaves you guessing. The most useful DXA connects what shoppers did to the technical reason behind it.
Built for retail and tied to revenue. Generic DXA shows behaviour; ecommerce DXA ranks it by the revenue at stake, so you fix the friction that actually costs you sales first.
Where Noibu fits
Noibu is an ecommerce analytics and monitoring platform, and digital experience analytics is one part of it. Page Analysis delivers heatmaps, click and scroll maps, and journey insight; Session Replay captures 100% of sessions with frustration signals flagged; and because it all sits in the same platform as Issues & Alerts, every behavioural insight can be tied to the technical cause and the revenue behind it — without sampling and without a tagging project.
For a hands-on walkthrough of using these capabilities, see our practical guide to Page Analysis. This article is the bigger-picture view of the category it belongs to.
Frequently asked questions
See the why behind your ecommerce metrics
Your analytics already tells you what happened. Digital experience analytics tells you why — and for an ecommerce team, the why is where the revenue is.
Want to see what your shoppers actually experience? Run a free Noibu website audit to see the behaviour and friction behind your numbers.