Make peak boring: How Noibu customers turn BFCM risk into revenue
Megan Glover
November 2, 2025
Feature spotlights
6× lower
revenue exposure than the median ecommerce site during peak
Mejuri, Ribble, Weyco, Harman
Zero outages
at record BFCM traffic after pruning heavy third parties
Weyco Group
TL;DR — what retailers get from Noibu during BFCM
Holiday traffic magnifies friction. Mobile, third-party dependencies, and promo complexity turn small defects into lost revenue.
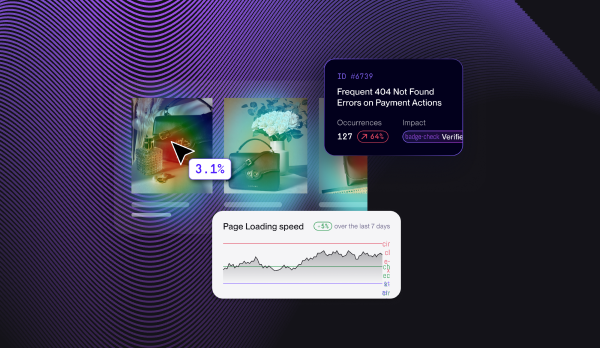
Noibu detects and prioritizes by dollars. Checkout, payments, and third-party failures are surfaced in minutes with developer-ready evidence.
Top brands cut revenue at risk by up to 6×. Mejuri, Ribble Cycles, Weyco, and Harman kept peaks stable and avoided outages.
Performance is a financial lever. Mobile Core Web Vitals and fast TTR convert technical fixes into recovered revenue.
Outcome: predictable, “boringly successful” BFCM—conversion holds, incidents resolve fast, and every fix shows up in dollars.
Explore the 2025 Peak Season Playbook
See how top ecommerce teams prepare for Black Friday and Cyber Monday with Noibu’s step-by-step operating model — from hardening before code freeze to post-peak analysis.
In 2024, ecommerce brands faced record BFCM traffic—and record risk. Mobile transactions made up nearly 70% of sales, third-party apps strained under load, and even small defects became multimillion-dollar revenue leaks.
To prepare for the 2025 season, leading retailers including Mejuri, Ribble Cycles, Weyco, and Harman turned to Noibu—the revenue observability platform that helps ecommerce teams uncover, prioritize, and act on conversion-blocking friction before it hits the bottom line.
Using Noibu, brands are able to:
Uncover and resolve critical checkout and payment issues in minutes instead of hours.
Cut revenue exposure by up to 6× compared with industry peers.
Maintain conversion and uptime throughout the highest-traffic weekend of the year.
The result: a quieter, more predictable peak season—where stability became a competitive advantage and BFCM revenue goals were hit without firefighting.
“A performance-first mindset makes a bigger impact on sales than any late-breaking feature.” — Matthew Lawson, CDO, Ribble Cycles
The challenge: Why BFCM is so risky
Black Friday and Cyber Monday are no longer just marketing events—they are the operating window that defines Q4 success.
Sales volume (USD, billions)
Cyber Monday 2024
$13.3B
Black Friday 2024
$10.8B
BNPL (U.S. Black Friday)
$0.686B
Share & growth (percent; YoY where noted)
Black Friday mobile share
69%
Global Black Friday weekend
43%
Key BFCM risk factors
Mobile conversion cliffs from slow or unresponsive UIs
Third-party fragility (reviews, payments, analytics SDKs) under heavy load
Promo integrity failures eroding customer trust
AI-driven personalization adding latency and new error surfaces
Even a 0.1% dip in conversion rate can equal millions in lost revenue at holiday volumes.
The Noibu approach: Discover fast, act smart, measure in dollars
Noibu helps ecommerce teams connect every moment of friction to its real financial impact.
Our platform turns technical signals—errors, slowdowns, drop-offs—into CFO-ready revenue metrics, so digital teams can prioritize what drives growth, not just what breaks.
The Holiday Elasticity Model
Noibu quantifies the relationship between site performance and revenue outcomes:
“Don’t live in fear of code changes… small, calculated enhancements can pay off big.”
Weyco Group
year-round optimization, zero outages
Optimized performance and pruned heavy vendors.
Result: zero outages despite record traffic.
“We compressed images, cleaned code, removed draggy third parties—handled higher volume with ease.”
Harman
governance beats adrenaline
Mid-October freeze, proactive audits, and clear escalation ladders.
Result: quiet, uneventful, record-revenue peak.
“No big moments—that’s how we know preparation worked.”
📊 Benchmarks & executive scorecard
These are the operating thresholds that predict BFCM revenue outcomes. During peak, they’re not just benchmarks—they’re survival lines.
Dimension
Metric
Target
Why It Matters
Performance
LCP ≤ 2.5s / INP ≤ 200 ms / CLS ≤ 0.10
Top quartile: LCP ≤ 1.6s / INP ≤ 128 ms / CLS ≤ 0.03
Faster sites convert more.
Reliability
Checkout ≥ 97–98%; Payment auth ≥ 95%
Detect in minutes; resolve in hours
Each % failure = millions lost.
Financial
RE trending ↓; RR trending ↑
Top performers’ RE ~6× lower than median
CFO-visible reliability metric.
Vertical snapshot:
Electronics ≈ 2.8 s LCP | Beauty ≈ 2.9 s | Fashion ≈ 3.2 s
Leadership cadence: 5 questions every monday
What’s our Revenue at Risk (RE) trend?
How much Revenue did we Recover (RR) last week?
What changed in mobile Core Web Vitals, and why?
Where are payment failures clustering?
How fast could we roll back the last deployment?
Outcome: From chaos to confidence
With Noibu, leading retailers turned Black Friday and Cyber Monday from unpredictable and reactive to measurable, stable, and revenue-positive.
Detection in minutes, not hours — critical checkout and payment friction surfaced instantly
6× less revenue exposure than the median ecommerce site
Peak weekends that ran quietly, converted confidently, and exceeded targets
The result: no firefighting, no surprises—just boringly successful peaks where ecommerce and engineering teams operated in sync, and every fix showed up in dollars.
Executive takeaway
Holiday 2025 will reward systems, not improvisation.
To win, make these four moves now:
Publish freeze and rollback policies early.
Stand up an RE/RR dashboard linked to Finance.
Finalize your war-room roster and mobile KPIs.
Treat every hour of degraded UX as financial loss.
Traffic is opportunity — but without performance and reliability, it’s also liability.
Quantify the gap, then close it with Noibu.
Frequently asked questions
Everything ecommerce and digital teams need to know about staying revenue-resilient during BFCM with Noibu’s revenue observability platform.
How does Noibu help during BFCM specifically?
Noibu helps ecommerce teams discover friction, focus on what impacts revenue most, and act fast. During BFCM, it surfaces checkout, payment, and third-party issues in minutes—prioritized by dollars at risk—with developer-ready replay for immediate action.
How do we quantify revenue at risk (RE) and recovered revenue (RR)?
RE = Sessions × Friction incidence × AOV × Purchase-intent%. RR = RE × Fix rate × (1 − TTR / peak window). Use Noibu’s estimates to prioritize fixes by dollars, not error counts.
What’s the “1% rule” for conversion during BFCM?
At peak scale, every 1% conversion swing matters. Example: 24M sessions × $110 AOV → $26.4M per 1% CR change. Even a 0.1 pt dip is material.
How does Noibu handle third-party outages (payments, reviews, analytics)?
Noibu monitors error spikes and endpoint health across critical flows and vendors. Teams can rehearse failovers or kill-switches and get alerted the moment a dependency degrades.
Do we need a code freeze? What changes are safe during peak?
Run a risk-based freeze. Allow content/CMS updates, promo config, and feature-flag toggles. Block library upgrades, schema changes, and new third parties. Break-glass only for critical checkout or security fixes with rollback.
How does Session Replay help support during BFCM?
Help Codes link support tickets to the exact shopper session. Agents escalate with evidence, and engineers jump straight to the failing interaction—cutting investigation time dramatically.
What’s the daily war-room cadence we should follow?
Daily 8 a.m. recap, live dashboards all day (CR by device, payment success, Core Web Vitals, spiking issues), 10 p.m. close-out, on-call 24/7. Decision path: Detect → Classify → Act → Verify → Communicate.
How does Noibu support AI/personalization components under peak load?
Include AI components in load tests, set latency budgets and fallbacks, and monitor model/API errors like payment failures. Noibu surfaces those errors and their revenue impact so you can decide to degrade gracefully or disable safely.
What metrics should digital leaders review weekly from Oct–Dec?
RE vs. RR trend and top money-unlocking fixes.
Mobile CWV shifts (LCP/INP/CLS) and why.
Payment failure clusters by provider, device, region.
Rollback readiness for the last deployment.
Need a deeper dive? Book a pre-peak audit to uncover your top revenue opportunities before Black Friday.


.avif)


.avif)
.avif)